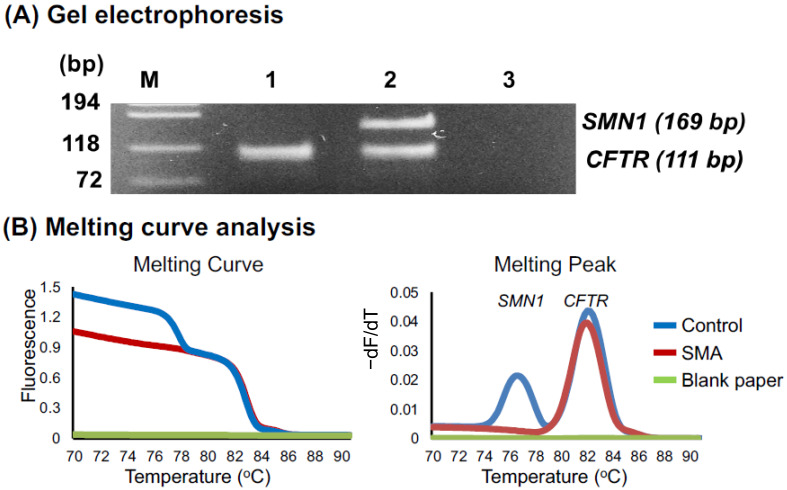
Figure 2.
Detection of SMN1. (A) Agarose gel electrophoresis of the second-round PCR products indicating the SMN1 band (169 bp) and the CFTR band (111 bp). Lanes M, 1, 2, and 3 represent the DNA ladder, SMA patient, healthy control, and blank paper, respectively. (B) Melting curve and melting peak analysis to detect SMN1/CFTR in a healthy DSS (blue line), an SMA DSS (red line), and a blank paper (green line).

