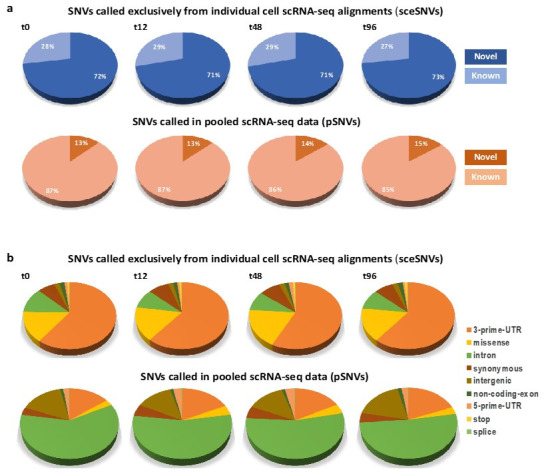
Figure 3.

(a). Percentage of novel and known SNVs called exclusively in the individual alignments (sceSNVs, top) and in the pooled scRNA-seq data (pSNVs, bottom). An approximately 5-fold higher percentage of novel SNVs was seen in the individual cell alignments. (b). Distribution of functional annotations among the SNVs called exclusively in the individual alignments (top), as compared to the pooled scRNA-seq data (bottom). Significantly higher proportions of 3’-prime-UTR, missense and stop-codon SNVs were called in the individual alignments.
