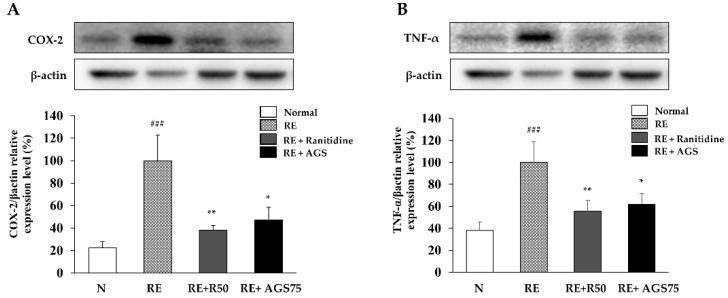
Figure 7.
Expression of inflammatory proteins in esophagus. The expression of COX-2 (A) and TNF-α (B) in esophageal tissue. Data were expressed as mean ± SD of duplicate experiment. Statistical analysis was performed for LPS compared with normal cells (### p < 0.001) and each sample compared with LPS-induced cells (* p < 0.05 and ** p < 0.01).

