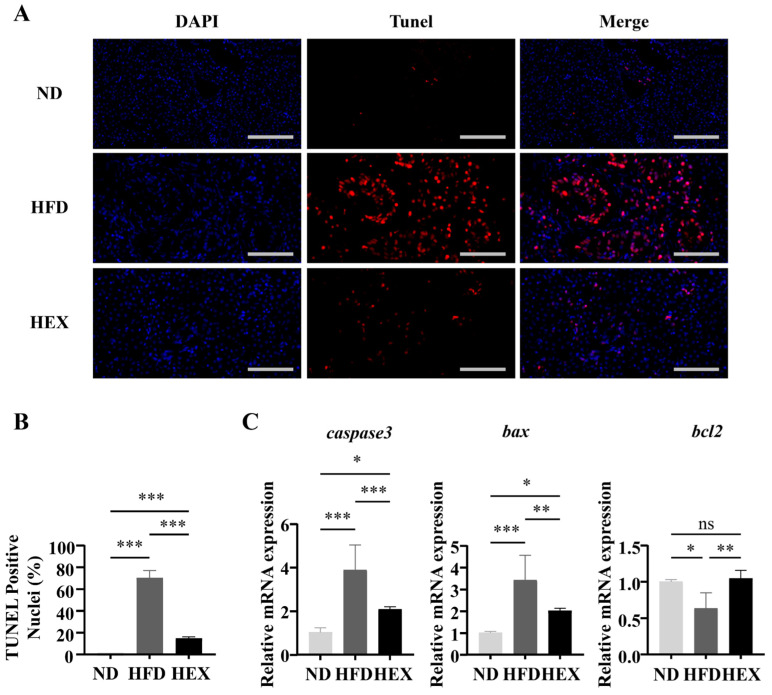
Figure 5.
Hepatocyte apoptosis in 9-month-old zebrafish livers. (A) Tunel staining of zebrafish livers, and (B) Quantitation of Tunel-positive cells (n = 3). (C) Gene expression of caspase3, bax, and bcl2 (n = 6). *, p < 0.05 **, p < 0.01, ***, p < 0.001. Data represent the mean, and error bars represent SEM. Scale bar, 20 μm. NAFLD, non-alcoholic fatty liver disease; ND, normal diet; HFD, high fat diet; HEX, high-fat diet plus exercise.

