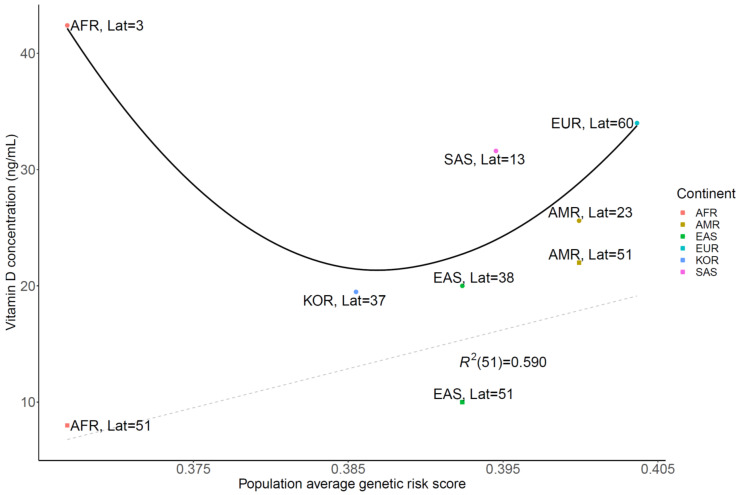
Figure 4.
Correlation plot of vitamin D concentration and genetic risk score using related single-nucleotide polymorphisms, with latitude. Vitamin D concentration was strongly correlated with average genetic risk score at the same latitude (R2 = 0.590) in the grey dashed line. Its original endogenous population vitamin D concentration vs genetic risk score fitted in the black line. (Lat: Latitude, AMR: American, EUR: European, SAS: South Asian, AFR: African, EAS: East Asian).

