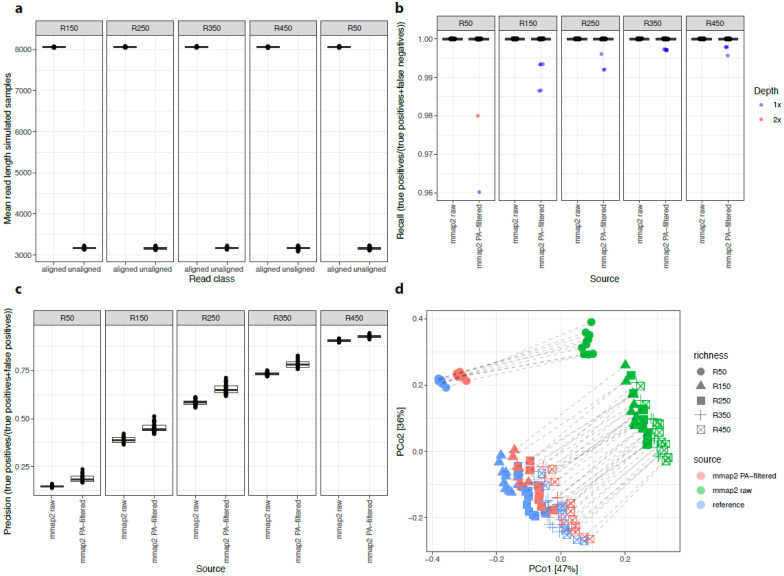
Figure 2.
Metagenomic profiles from simulated samples between minimap2 results and minimap2 results filtered from secondary alignments. (a) Boxplots of mean lengths of ONT reads of 250 simulated samples (y-axis) between those aligned and unaligned over the 506 reference genomes from minimap2 results (x-axis). (b) Boxplots of recall values of species richness estimates in 250 simulated samples (y-axis) between metagenomic profiles inferred from all minimap2 alignments (mmap2 raw) and from minimap2 primary alignments only (mmap2APfilt, x-axis). For simulated samples not reaching the recall of 1, the sequencing depth is highlighted in different colors. (c) Boxplots of precision values of species richness estimates in 250 simulated samples (y-axis) between metagenomic profiles inferred from all minimap2 alignments (mmap2 raw) and from minimap2 primary alignments only (mmap2APfilt, x-axis). (d) PCoA of metagenomic profiles from the reference and 250 simulated samples inferred from all minimap2 alignments (mmap2raw) and from minimap2 primary alignments only (mmap2APfilt, x-axis). Dashed lines connect points coming from the same sample (reference, simulated ones; 3 points per sample).

