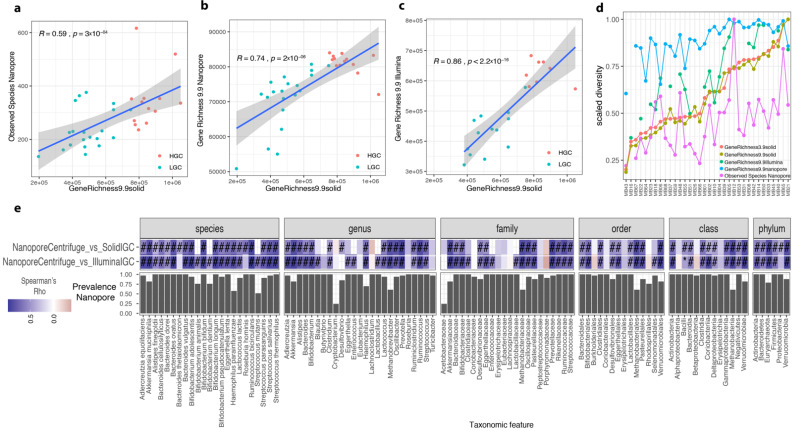
Figure 7.
Comparison of semi-quantitative metagenomic profiles of Microbaria samples between sequencing technologies. Correlation between gene richness from SOLiD sequencing (x-axis) and observed species inferred from Nanopore (ONT) sequencing data using Centrifuge approach ((a) n = 33), gene richness inferred from ONT sequencing data ((b) n = 33), and gene richness inferred from Illumina sequencing data ((c) n = 21). The strength of the similarities was evaluated with Spearman correlation test (Spearman rho and p-value included in the scatterplots). (d) Line plots representing the scaled diversity (from 0 to 1) of Microbaria samples from different diversity metrics based on SOLiD, ONT, and Illumina sequencing data. Samples in x-axis are ordered based on the scaled diversity of the gene richness from the original Microbaria study (GeneRichness3.9SOLiD). (e) Heatmap of Spearman rho representing similarities in abundance vectors of taxonomic features in x-axis between ONT quantifications based on Centrifuge data and Illumina and SOLiD quantifications based on metagenomic species of the IGC (y-axis; #= p-value adj < 0.05, BH method; * = p-value < 0.05). On the bottom of the heatmap is represented the prevalence of taxonomic features in x-axis based on ONT sequencing data.

