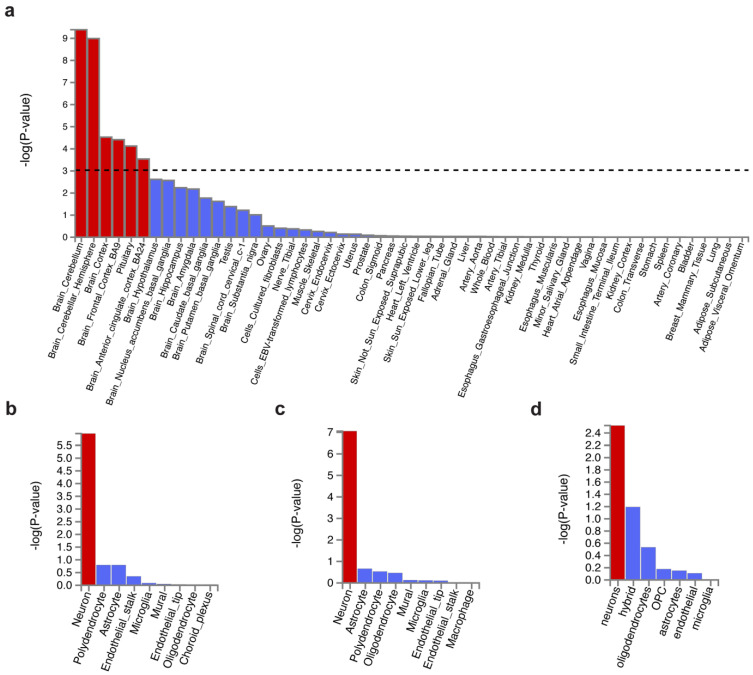
Figure 2.
Tissue expression and cell type specificity enrichment of genes associated with shared genetic variants. (a) Tissue expression enrichment in GTEx 54 tissue types. The dashed line indicates the significance threshold at p = 0.001. (b–d) Cell type specificity in (b) cerebellum, (c) frontal cortex BA9, and (d) BA24. Bars in red represent significant enrichment.

