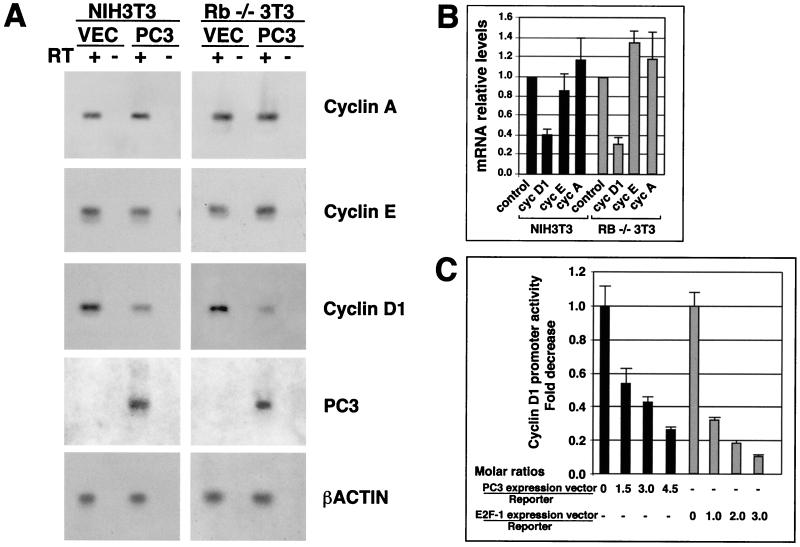
FIG. 6.
Inhibition of cyclin D1 transcription by PC3. (A) Inhibition of cyclin D1 mRNA levels in NIH 3T3 and Rb−/− 3T3 cells by PC3. Cells (3 × 10⁵) were seeded onto 90-mm-diameter culture dishes and transfected with either pSCT empty plasmid or pSCT-PC3 (21 μg each) together with a plasmid encoding the CD20 cell surface marker (pCMVCD20, 3 μg), as described for Fig. 4. Sixty hours after, cells were isolated by CD20-specific cell sorting (obtaining 3 × 10⁵ to 5 × 10⁵ cells), and total RNA was extracted. The specific mRNA species indicated were visualized by RT-PCR analysis using specific primers. Equal amounts of RT-PCR products amplified from NIH 3T3 or Rb−/− 3T3 sorted cells, transfected with either pSCT-PC3 or the empty vector, were electrophoresed, blotted on a filter, and hybridized to probes for cyclins A, E, and D1; PC3; and β-actin. RT “+” or “−” indicates the products of amplification performed in parallel on two aliquots of each RNA starting sample preincubated or not with RT, respectively, in order to check the presence of DNA contamination. Control amplifications using as template the cDNA corresponding to each mRNA species gave a signal of the expected size (data not shown). (B) Relative levels of the mRNAs, as means ± SEM of three independent experiments, of which a representative one is shown in panel A. Values were obtained by measuring Southern blot densities of the PCR product of each experiment with a PhosphorImager system and were represented as ratios of the density observed in pC3-transfected cells to the corresponding one in pCST-transfected cells (assumed to be 1; see control bars). Values were then corrected for the corresponding β-actin relative expression, according to the following formula: relative sample density = sample density in PC3-transfected cells × 100/sample density in vector-transfected cells/(β-actin density in PC3-transfected cells × 100/β-actin density in vector-transfected cells). Black bars, NIH 3T3 cells; grey bars, Rb−/− 3T3 cells. (C) Inhibitory effect of PC3 on cyclin D1 promoter activity. NIH 3T3 cells (105) seeded onto 35-mm-diameter culture dishes were transfected after 24 h with either pSCT-PC3 or CMV–E2F-1 or the corresponding empty plasmids. Forty-eight hours after transfections, cell lysates were collected and assayed for luciferase activity. The fold decrease in luciferase activity was calculated relative to the level of control samples (transfected with the empty vectors), which were set to the unit. The bars represent the average fold activities ± SEM of three independent experiments performed in duplicate. The luciferase activities were measured in luciferase units per microgram of protein normalized to the amount of plasmid DNA present in each extract (black or grey bars). The ratio of transfected expression vector to reporter plasmid is shown on the abscissa. The amount of reporter used was 0.5 μg, while the highest amount of pSCT-PC3 and CMV–E2F-1 was 1.5 μg (corresponding to a molar ratio of expression vector to reporter of 4.5 and 3.0, respectively).

