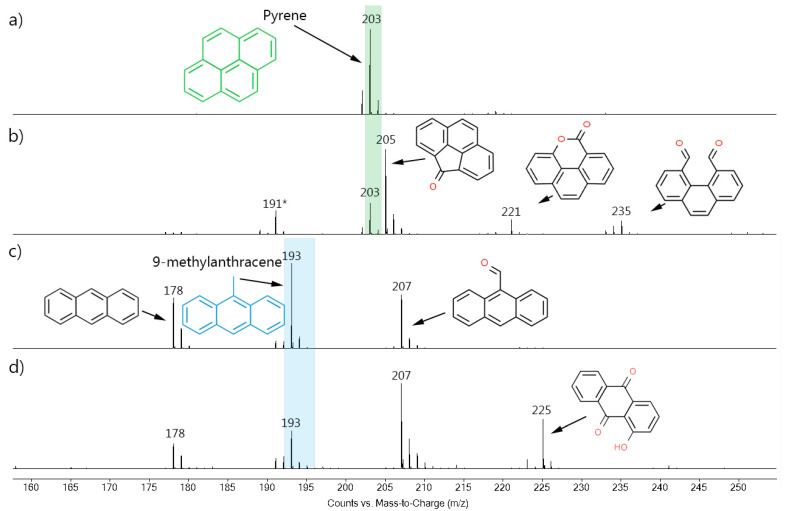
Figure 3.
MS spectra of the (a) untreated and (b) treated pyrene; and of the (c) untreated and (d) treated 9-methylanthracene, both in the homogeneous ozonolysis experiments performed using acetonitrile as solvent. Green and blue rectangles indicate pyrene and 9-methylanthracene signals, respectively. * indicates unidentified structure.

