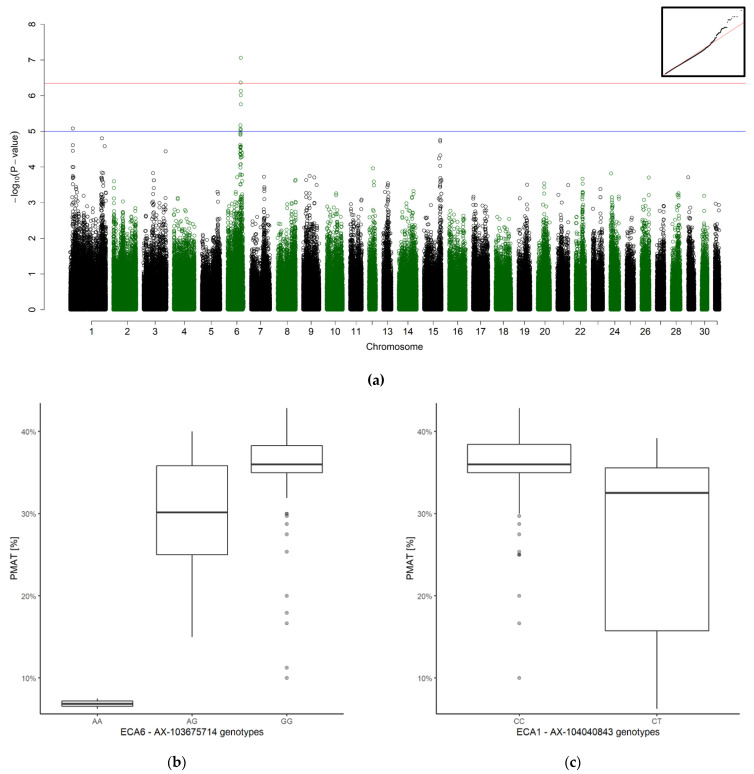
Figure 1.
Genome-wide association for progressive motility after thaw (PMAT, n = 109). (a) Manhattan plot (blue line representing the suggestive significant threshold (p < 10−5) and (red line) the Bonferroni-corrected significance threshold (pind < 4.56 × 10⁻⁷). The inset on the right-hand corner shows the quantile-quantile (Q-Q) plot with the observed p-value plotted against the expected one. (b,c) Boxplots representing the genotype effect of the best associated SNP on ECA6 (b) and ECA1 (c) on progressive motility after thaw.

