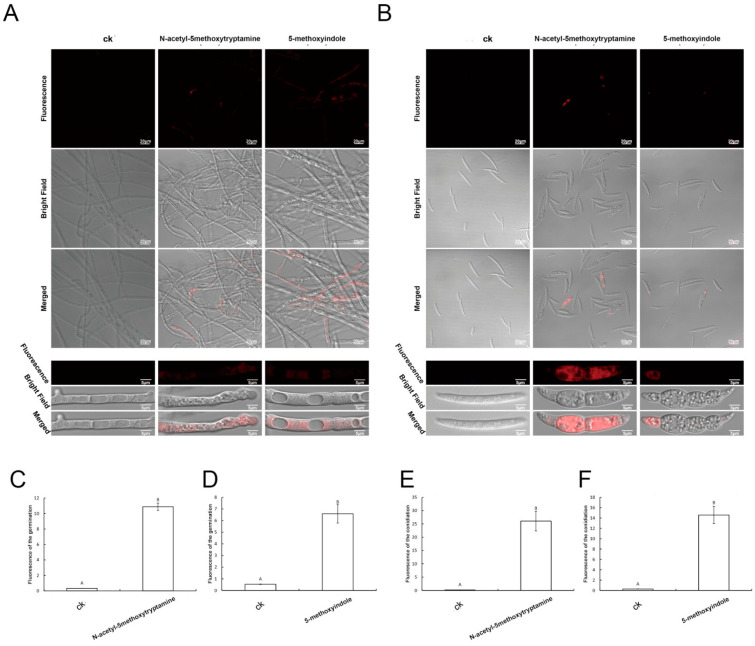
Figure 8.
(A,B) Detection of F. graminearum hyphae and conidia viability based on propidium iodide staining after treatment with 4 mM melatonin and the 0.1 mM 5-methoxyindole for 3 days. Fungal cells with damaged membranes show red fluorescence; 0.05% (vol/vol) methanol/water served as the ck; (C,D) Analysis of the average fluorescence of the F. graminearum hyphae after treating with the melatonin and 5-methoxyindole for 3 days; (E,F) Analysis of the average fluorescence of the F. graminearum conidia after treating with the melatonin and 5-methoxyindole for 3 days. The error bars represent the mean standard deviation of each treatment repeated three times with three replicates. The letters above the columns indicate significant differences. The significant difference between the treatments was determined through Tukey’s HSD test at p ≤ 0.05. The higher level of green fluorescence indicates the high level of ROS induction in F. graminearum exposed to the melatonin and 5-methoxyindole.

