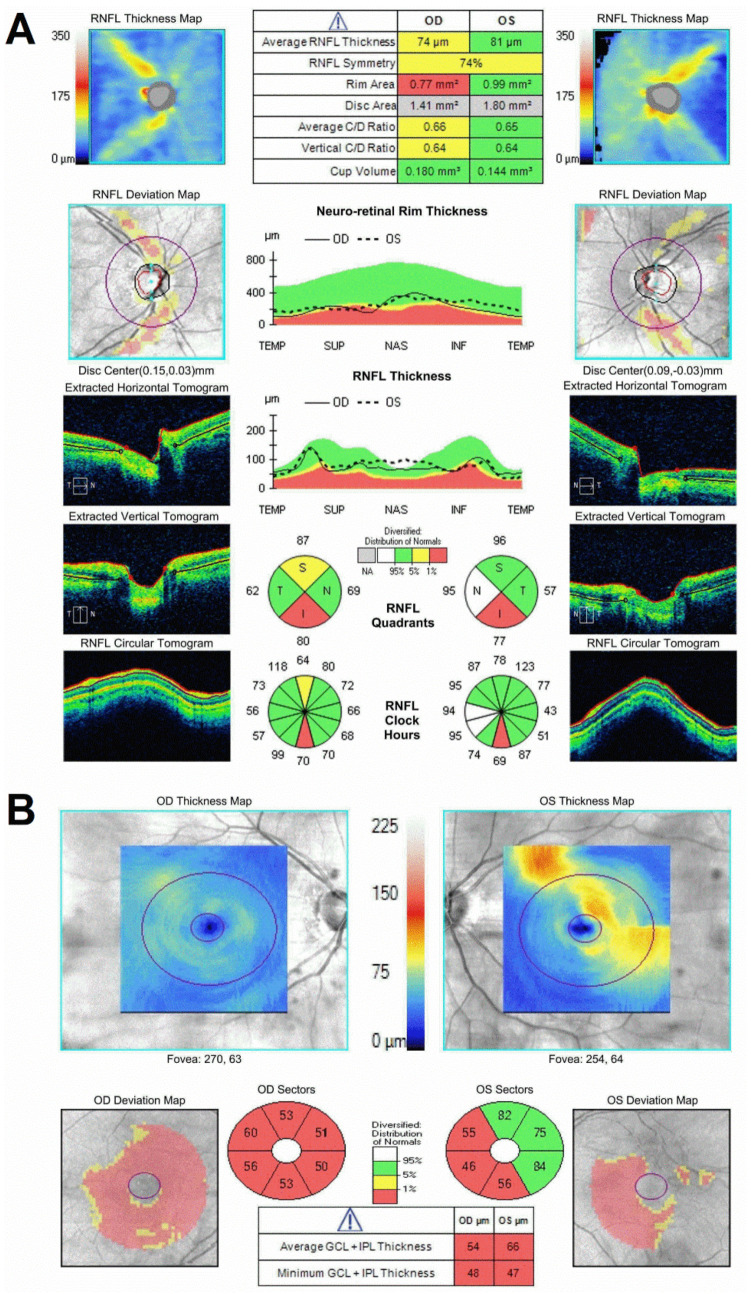
Figure 2.
Optic nerve and retinal photography by OCT demonstrating vertical optic nerve atrophy with associated thinning in the retinal ganglion cell layer. SD−OCT of the peripapillary and central retina in the WDR36-positive patient. (A) SD−OCT of the peripapillary retina in the patient. Sides (left and right columns) are plots of the topography of the peripapillary RNFL thickness as raw thickness values (top row) and as deviation maps (second row) compared to a normative database for the right (left panels) and left (right panels) eyes of the patient. The bottom three rows of panels below are horizontal (top) and vertical (middle) cross-sections SD−OCT scans through the optic nerve, as well as circular scans cross-sectional tomograms around the optic nerve. The middle column is summary parameters. (B) SD−OCT of the central and pericentral retina in the patient. Top panels are topographic maps of the GCL thickness (there are segmentation artifacts shown as localized thickened GCL in the left eye). Bottom panels are GCL thickness summary parameters compared to a normal distribution database.

