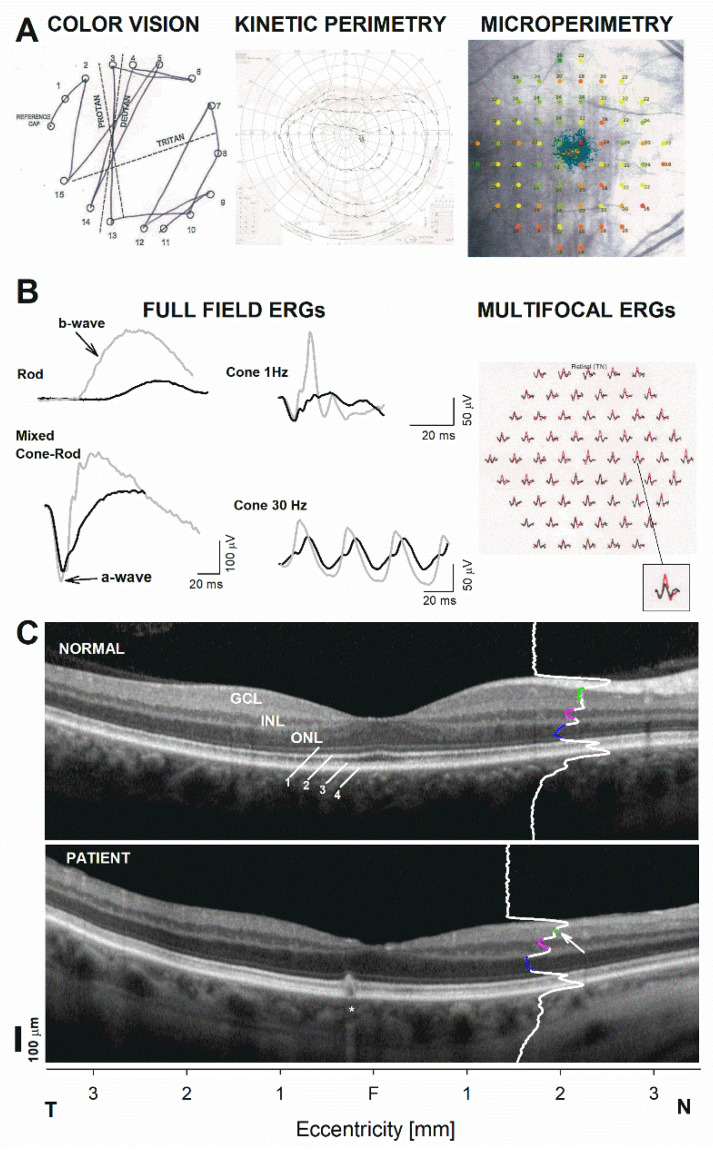
Figure 3.
Detailed functional and structural phenotyping of the WDR36-positive patient using color vision and perimetric functional analysis, followed by electrophysiology. Only one eye is shown for clarity; results are nearly identical in the contralateral eye. (A) Left panel: color vision documented with a Farnsworth–Munsell D15 test; middle panel: Goldman kinetic perimetry to three stimulus conditions (V-4e, III-4e and I-4e); right panel: dark-adapted (>30 min), fully dilated fundus perimetry or microperimetry (MAIA, CenterVue, Padova, Italy) from our patient. Sensitivities are shown as numerical values next to the testing (a 68 point, conventional ‘10-2 protocol’ grid), as well as color-coded sensitivity losses compared to a normative database (green symbols, ≥25 dB, considered a rough lower limit of normal across the grid). Blue-green traces near the center portray prefer locus and fixation excursions. (B) Standard electroretinography elicited using a commercially available system (Espion e3, Diagnosys LLC, Lowell, MA, USA). Standard full-field electroretinograms (ffERGs) recorded in scotopic (left panel) and photopic (middle) conditions, as well as multifocal electroretinograms (mERG) (right) across the central 20 degrees are shown. ff-ERGs from the patient overlap representative normal responses, gray traces. m-ERG traces in the patient, black traces, are also compared to average normal traces (red). Mixed cone-rod response is elicited with a standard flash (nominal 3.0 setting of standard). A magnified comparison from a parafoveal location is shown to the bottom right to illustrate a perfect match of the photoreceptor a-wave component which contrasts with the inner retina, b-wave, component. (C) Horizontal SD-OCT (Spectralis, Heidelberg Engineering, Heidelberg, Germany) through the foveal center in the patient compared to a representative normal subject. Nuclear layers are labeled: outer nuclear layer = ONL, inner nuclear layer = INL, ganglion cell layer = GCL. Outer retinal sublaminae are labeled as: 1. Outer limiting membrane (OLM), 2. Inner segment ellipsoid band (EZ), 3. Interdigitation of the photoreceptor outer segment tip with the apical RPE (IZ), 4. Retinal pigment epithelium and Bruch’s membrane (RPE/BrM). A longitudinal reflectivity profile is shown overlapping the cross section, 2 mm in nasal retina. Colored segments denote the extent of the signal trough that corresponds to the ONL (blue), the INL (pink), and the GCL (green). Arrow points to a thinned GCL, asterisk denotes incidental pigment epithelial detachment in the temporal juxtafovea. T, temporal retina. N, nasal retina.

