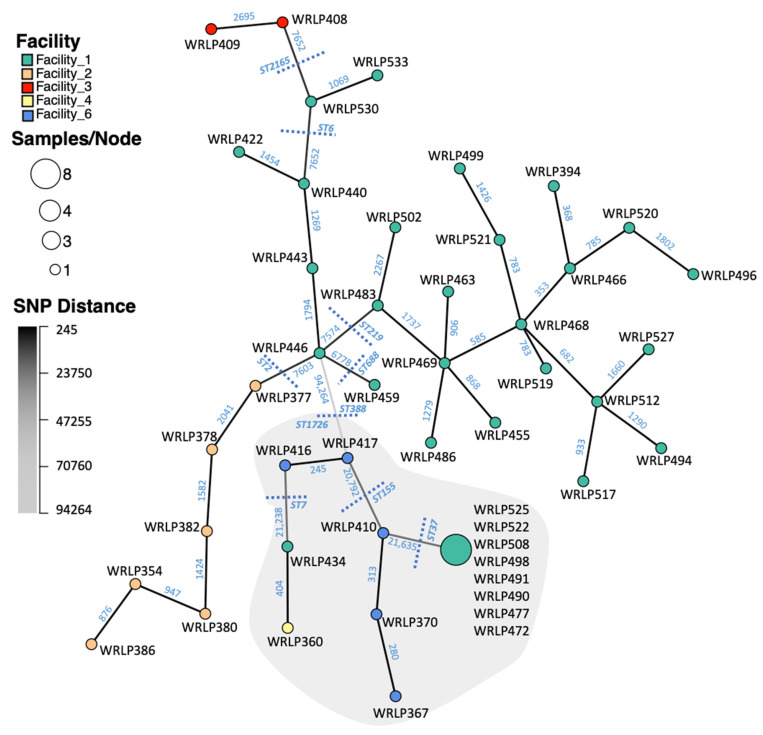
Figure 2.
Minimum spanning network (MSN) of whole genome SNPs identified amongst 48 Listeria monocytogenes genomes. Nodes represent genotypes of isolates with <3 pairwise SNP differences and node size is proportional to the number of isolates of that genotype. Node color indicates the produce facility where each strain was sourced. Branch color and bales indicate the number of pairwise SNPs between genotypes (i.e., darker colors indicate fewer differences). Dashed lines illustrate where ST groupings fall in relation to the minimum spanning network. Grey background shows isolates belonging to lineage II (serotype 1/2a or 3a) whereas a white background shows isolates belonging to lineage I (serotype 4b, 4d, or 4e).

