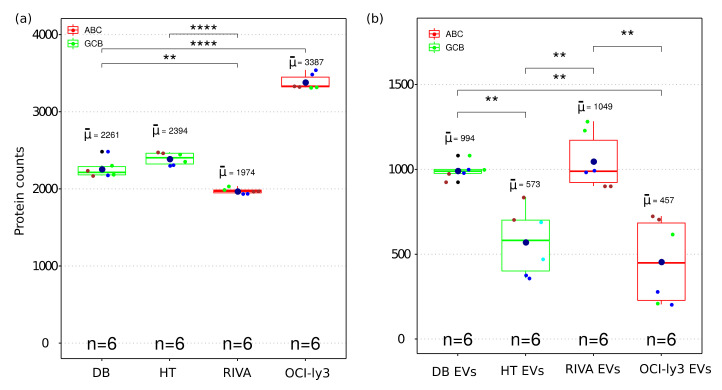
Figure 2.
Boxplot of the number of identified proteins in whole cell (a) and EV (b) proteome from four DLBCL cell lines representing GCB and ABC sub types. The boxes indicate the median, second and third quartile. Mean values are represented by the large dark blue circles, while data points representing individual LC-MSMS runsare represented by smaller circles. All biological replica are depicted by a different small circle color and technical replica by identical small circle color. (**) correspond to p-value <0.01. (****) correspond to p-value < 0.0001.

