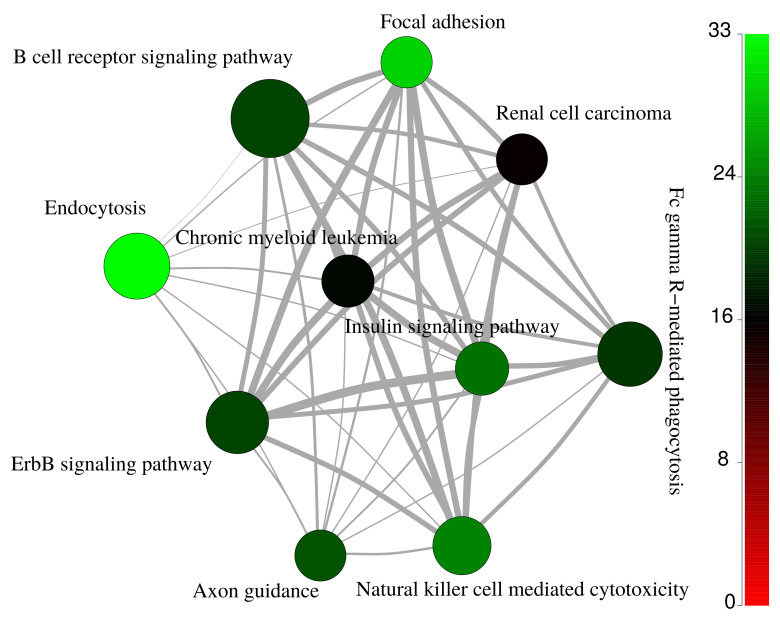
Figure A4.
Interconnection of the most enriched KEGG pathways for regulated EVs proteins. The color coding of the nodes indicates the number of proteins regulated for each category. The size of the nodes reflects log10 of enrichment p value. The thickness of the edges reflects the number of shared regulated proteins between the KEGG pathways (ranging from 1 to 18 proteins).

