. 2021 Sep 16;10:e67535. doi: 10.7554/eLife.67535

Figure 1. Oxytocin (Oxt) neurons modulate the progression of azoxymethane (AOM)/dextran sodium sulfate (DSS)-induced colitis-associated cancer (CAC) in mice.

(A) A schematic diagram showing the strategy of generating OxtCre;DTA mice. When Cre recombinase is present, loxP-flanked Stop cassette is excised, therefore allowing the expression of DTA176 in Oxt neurons. Triangles represent loxP sites. Ires, internal ribosome entry site. pA, simian virus 40 polyadenylation signal. (B) The CAC was induced in the 2-month-old OxtCre and OxtCre;DTA mice using AOM and DSS (see also Figure 1—figure supplement 1D). After completing the experiment, immunofluorescent staining for Oxt (green) indicated that Oxt neurons had been depleted in the paraventricular nucleus (PVN) of OxtCre;DTA mice. Cell nuclei were counterstained with DAPI (blue). Scale bars, 100 μm. (C) The number of Oxt-positive cells in the PVN. n = 4 mice per group. (D and E) The CAC was induced in the 2-month-old OxtCre and OxtCre;DTA mice using AOM and DSS. Tumor number (D) and diameter (E) in mice treated with AOM/DSS are shown. n = 6 (OxtCre) or 5 (OxtCre;DTA) mice per group. (F) The density of proliferating cell nuclear antigen (PCNA)-positive cells in the tumor tissues of AOM/DSS-treated OxtCre and OxtCre;DTA mice. n = 4 mice per group. (G) The density of terminal deoxynucleotidyl transferase dUTP nick end labeling (TUNEL)-positive cells in tumor tissues. n = 4 mice per group. (H) Schematic diagrams showing that the indicated adeno-associated viruses (AAVs) were injected into mouse PVN. (I) Adult male OxtCre mice were injected with AAV-hSyn-GFP (control) or AAV-hSyn-DIO-hM3Dq-mCherry (hM3Dq) viruses into the PVN, and were then administered with AOM and DSS. The mice were i.p. injected with clozapine-N-oxide (CNO) every other day for 3 weeks (see also Figure 1—figure supplement 2D). Two hours after the final dose of CNO, mice were perfused with 4% paraformaldehyde (PFA). For control, we carried out double immunofluorescence staining for c-Fos (gray) and Oxt (red). For hM3Dq, immunostaining for c-Fos (green) was performed, and Oxt neurons were identified using hM3Dq-mCherry (red). DAPI staining is in blue. Scale bars, 50 μm. (J) The percentage of OxtPVN neurons expressing c-Fos. n = 4 mice per group. (K and L) Male OxtCre mice (2 months of age) were injected with the indicated AAV into PVN, and were then treated with AOM and DSS. Subsequently, mice were i.p. administered with CNO every other day for 3 weeks. The animals were then sacrificed and tumor number (K) as well as diameter (L) were assessed. n = 6 mice per group. (M) The density of PCNA-positive cells in tumor tissues. n = 4 (control) or 3 (hM3Dq) mice. (N) The density of TUNEL-positive cells in tumor tissues. n = 3 mice per group. Data are shown as means ± SEM. *p < 0.05, **p < 0.01, ***p < 0.001, two-tailed Student’s t-test (C–G, J–N).

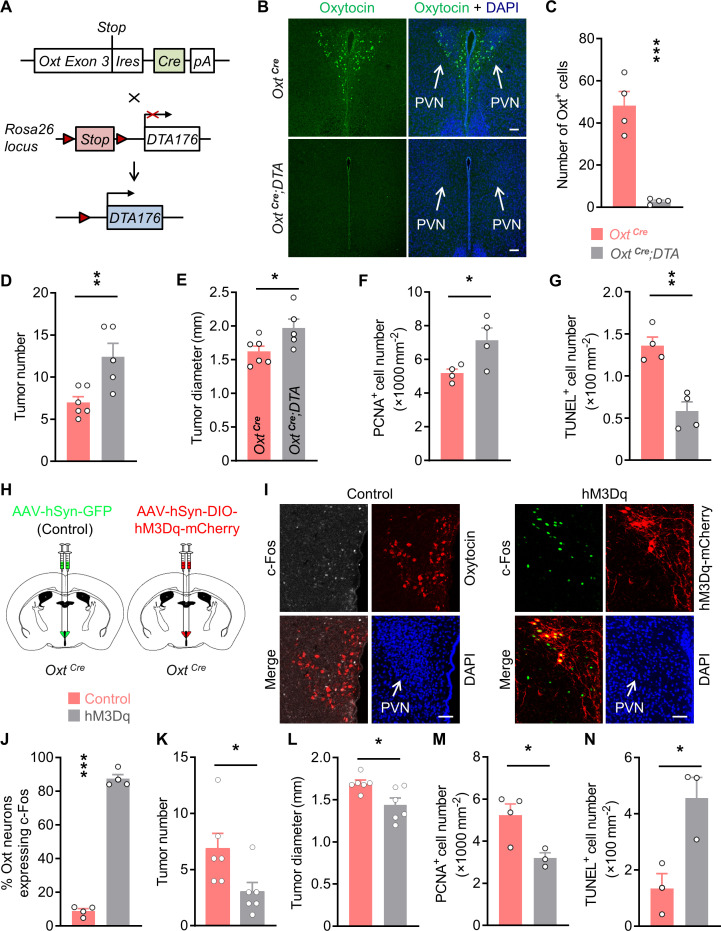
Figure 1—source data 1. Source data for Figure 1, panels C-G and J-N.

Figure 1.

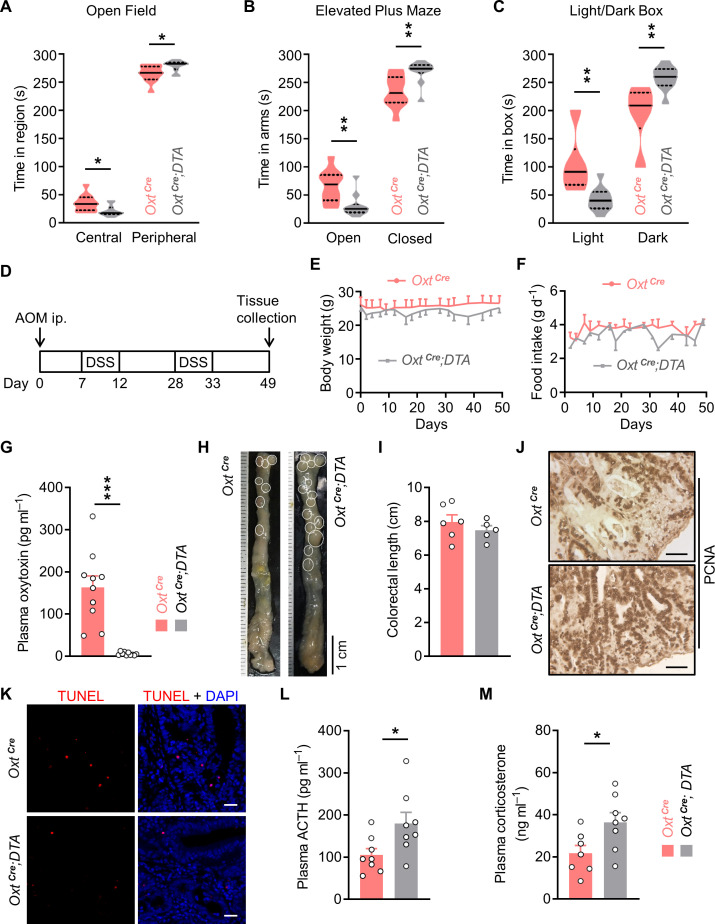
Figure 1—figure supplement 1. Depletion of oxytocin (Oxt) neurons increases anxiety level and promotes colitis-associated cancer (CAC) development in mice.

Figure 1—figure supplement 1.

(A) Open field test. The time spent in the central and peripheral regions of OxtCre and OxtCre;DTA mice at 2 months of age. Solid and dotted lines indicate medians and quartiles. n = 11 mice per group. (B) Elevated plus maze test. The time spent in the open and closed arms of the indicated mice. n = 10 mice per group. (C) Light/dark box test. The time spent in the light and dark boxes. n = 10 mice per group. (D) Schematic diagram of the azoxymethane/dextran sodium sulfate (AOM/DSS) protocol. (E and F) Body weight (E) and food intake (F) in the mice under AOM/DSS treatment. n = 6 (OxtCre) or 5 (OxtCre;DTA) mice per group. (G) The plasma Oxt levels in mice at the end of the experiment. n = 10 mice per group. (H) Representative images of colon and rectum collected from the AOM/DSS-treated OxtCre and OxtCre;DTA mice. White eclipses indicate individual tumor. (I) Colorectal length. n = 6 (OxtCre) or 5 (OxtCre;DTA) mice per group. (J) Immunohistochemical staining for proliferating cell nuclear antigen (PCNA) of the tumor tissues collected from the AOM/DSS-treated mice. Scale bars, 50 μm. (K) Terminal deoxynucleotidyl transferase dUTP nick end labeling (TUNEL) labeling (red) of tumor tissues. Cell nuclei were counterstained with DAPI (blue). Scale bars, 20 μm. (L and M) The plasma samples of OxtCre and OxtCre;DTA mice after the treatment were collected. Plasma adrenocorticotropin (ACTH) (L) and corticosterone (M) levels were then measured. n = 7 (OxtCre, corticosterone) or 8 (all other groups) mice per group. Data are presented as means ± SEM (E–G, I, L, M). *p < 0.05, **p < 0.01, ***p < 0.001, two-tailed Student’s t-test (A–C, G, I, L, M).
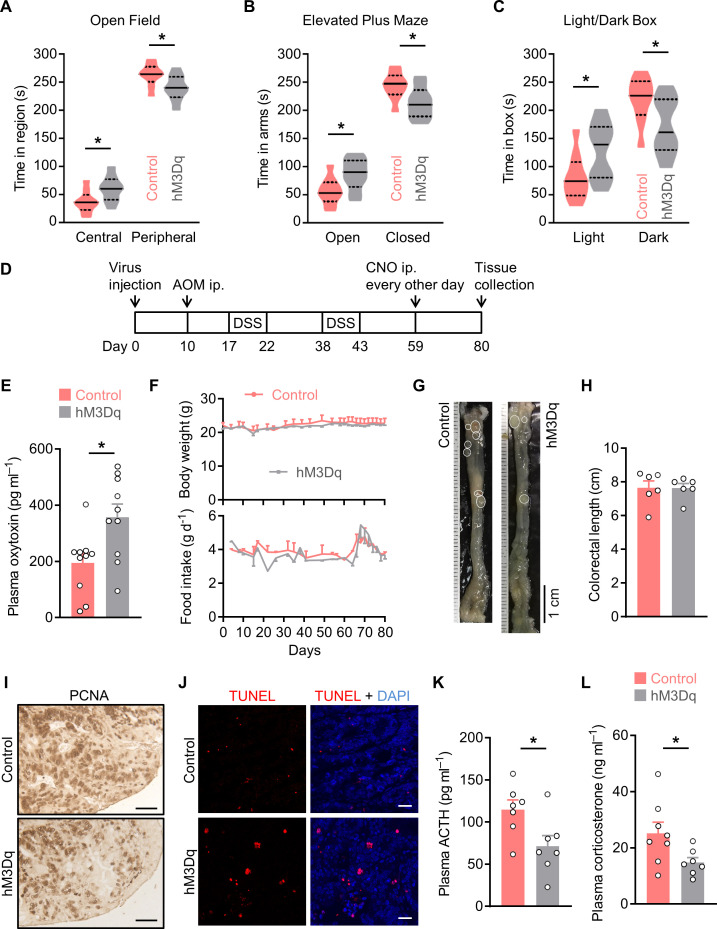
Figure 1—figure supplement 2. Excitation of OxtPVN neurons inhibits colitis-associated cancer (CAC) progression.

Figure 1—figure supplement 2.

(A) Open field test. The control and hM3Dq adeno-associated viruses (AAVs) (hM3Dq) were injected into the paraventricular nucleus (PVN) of OxtCre mice. These mice were i.p. administered with clozapine-N-oxide (CNO) (3 mg kg–1) for 2 weeks, and then the open field test was performed. The time spent in the central and peripheral regions were recorded. Solid and dotted lines indicate medians and quartiles. n = 9 mice per group. (B) In elevated plus maze test, the time spent in the open and closed arms were assessed. n = 9 mice per group. (C) The time spent in the light and dark boxes in the light/dark box test. n = 9 mice per group. (D) Schematic diagram of the experimental design. The male OxtCre mice (2 months of age) were injected with the indicated AAV into the PVN, and were then treated with azoxymethane (AOM) and dextran sodium sulfate (DSS). Subsequently, CNO was i.p. administered every other day for 3 weeks. (E) The plasma oxytocin levels in mice at the end of the experiment. n = 10 mice per group. (F) Body weight (top) and food intake (bottom) in mice throughout the experiment. n = 6 mice per group. (G) Representative images of colorectal tissue. White eclipses indicate individual tumor. (H) Colorectal length. n = 6 mice per group. (I) Immunohistochemical staining for proliferating cell nuclear antigen (PCNA) of tumor tissues. Scale bars, 50 μm. (J) Terminal deoxynucleotidyl transferase dUTP nick end labeling (TUNEL) labeling (red) of tumor tissues. Cell nuclei were counterstained with DAPI (blue). Scale bars, 20 μm. (K and L) Plasma adrenocorticotropin (ACTH) (K) and corticosterone (L) levels at the end of the experiment. n = 8 (control, corticosterone) or 7 (all other groups) mice per group. Data are presented as means ± SEM (E, F, H, K, L). *p < 0.05, two-tailed Student’s t-test (A–C, E, K, L).
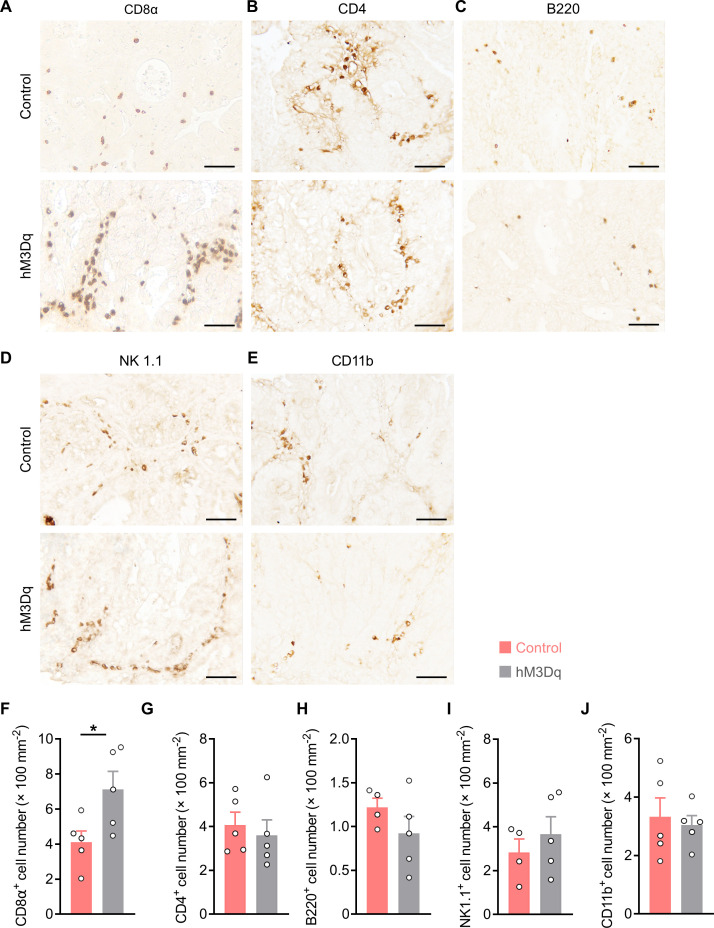
Figure 1—figure supplement 3. Density of immune cells in tumor tissues.

Figure 1—figure supplement 3.

(A–E) The male OxtCre mice (2 months of age) were injected with the indicated adeno-associated viruses (AAVs) into the paraventricular nucleus (PVN), and were then treated with azoxymethane (AOM) and dextran sodium sulfate (DSS). Thereafter, clozapine-N-oxide (CNO) was i.p. injected every other day for 3 weeks. Immunohistochemical stainings for CD8α, CD4, B220, NK1.1, and CD11b of tumor tissue sections were carried out. Representative images are shown. Scale bars, 50 μm. (F–J) The density of immune cells in tumor tissue. n = 4 (control, B220 or control, NK1.1) or 5 (all other groups) mice per group. Data are presented as mean ± SEM. *p < 0.05, two-tailed Student’s t-test (F).