. 2021 Sep 16;10:e67535. doi: 10.7554/eLife.67535

Figure 4. Celastrol enhances the excitability of OxtPVN neurons, and its administration in the brain inhibits colitis-associated cancer (CAC) progression.

(A) Electrophysiology of paraventricular nucleus (PVN) slice of 4-month-old OxtCre;EYFP mice. Left, a differential interference contrast (DIC) image of the recorded neuron (arrow). Middle, expression of enhanced yellow fluorescent protein (EYFP) (green) in the same cell suggests that it is an oxytocin (Oxt) neuron. Right, merged image. Scale bar, 10 μm. (B) Voltage response of Oxt neuron in response to 100 and –50 pA current injection in control and celastrol (5 μM in artificial cerebrospinal fluid [aCSF]) conditions. (C) Bath application of celastrol increased the number of action potentials (AP) fired across increasing current injections. n = 20 cells from five mice (control or celastrol). (D) Representative AP traces from control and celastrol conditions. Arrowhead indicates the AP threshold. (E–G) The size of afterhyperpolarization (AHP) (E), AP threshold, (F) and input resistance (Rm) (G) in control and celastrol conditions. Solid and dotted lines indicate medians and quartiles, respectively. n = 23 cells (E, F) or 27 cells (G) from five mice (control) or 28 cells from five mice (celastrol). (H and I) The CAC was induced in male C57 BL/6 mice (2 months of age) using azoxymethane (AOM) and dextran sodium sulfate (DSS). These animals were then i.c.v. administered with control versus celastrol every other day for 3 weeks. After the treatment, tumor number (H) and diameter (I) were determined. n = 10 (control) or 8 (celastrol) mice per group. (J) Colorectal length. n = 10 (control) or 8 (celastrol) mice per group. (K) The density of proliferating cell nuclear antigen (PCNA)-positive cells in tumor tissue. n = 5 mice per group. (L) The density of terminal deoxynucleotidyl transferase dUTP nick end labeling (TUNEL)-positive cells in tumor tissue. n = 5 mice per group. Data are presented as means ± SEM (C, H–L). *p < 0.05, **p < 0.01, ***p < 0.001, two-way ANOVA with Bonferroni’s post hoc test (C), or two-tailed Student’s t-test (E, G, H, I, K, L).

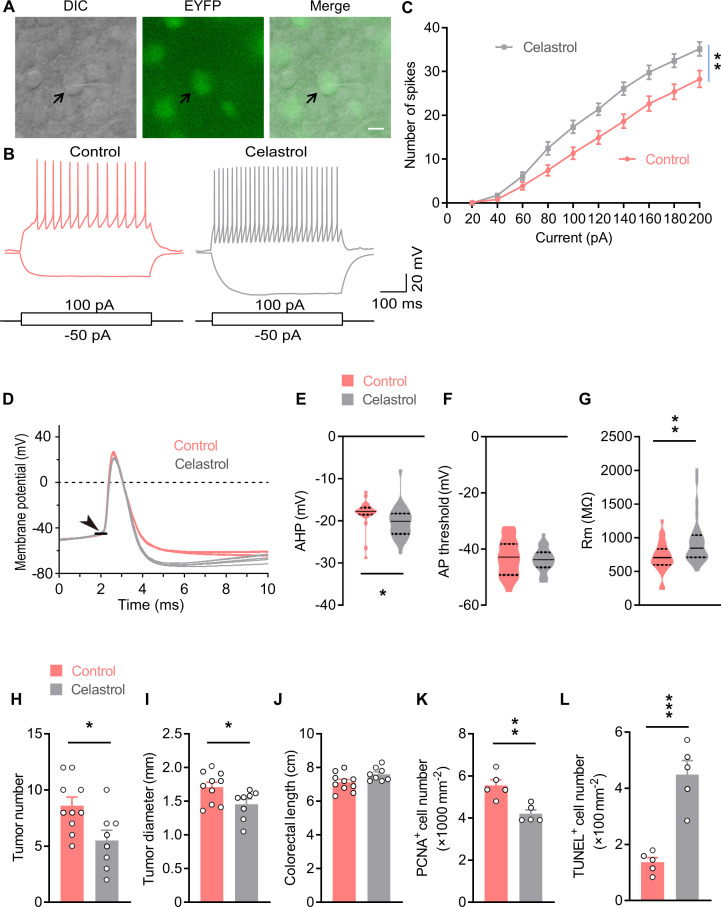
Figure 4—source data 1. Source data for Figure 4, panels C and E-L.

Figure 4.

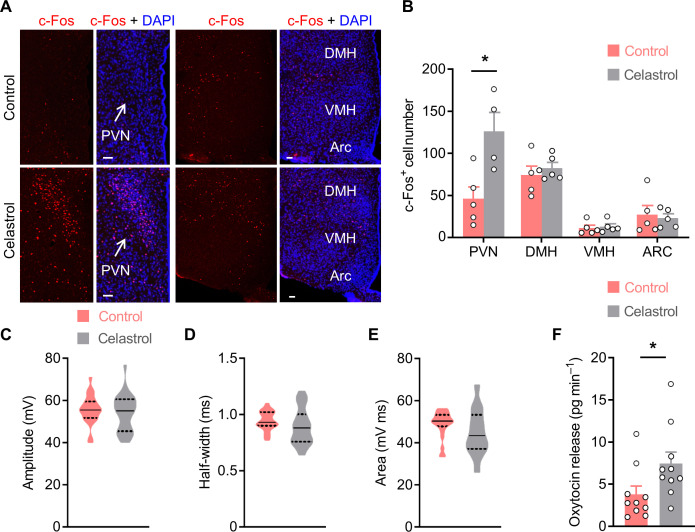
Figure 4—figure supplement 1. Celastrol excites neurons in the PVN and promotes Oxt release from PVN.

Figure 4—figure supplement 1.

(A) Male C57 BL/6 mice (2 months of age) were i.c.v. administered with vehicle or celastrol (0.5 µg). Two hours later, the mice were anesthetized, and were then perfused with 4% paraformaldehyde (PFA). Immunofluorescent staining for c-Fos (red) of brain tissue sections was carried out. Representative images display the expression of c-Fos in the paraventricular (PVN), dorsomedial (DMH), ventromedial (VMH), and arcuate (Arc) nuclei. Cell nuclei were counterstained with DAPI (blue). Scale bars, 50 μm. (B) The number of c-Fos-positive cells in the neuronal nuclei. n = 4 (celastrol, PVN) or 5 (all other groups) mice per group. (C–E) Action potential amplitude (C), half-width (D), and area (E) in control and celastrol condition (5 μM in artificial cerebrospinal fluid [aCSF]). Solid and dotted lines indicate medians and quartiles, respectively. n = 23 cells from five mice (control) or 28 cells from five mice (celastrol). (F) The PVN tissue slices of male C57 BL/6 mice (2 months of age) were dissected from the brain. Basal and celastrol-elicited oxytocin (Oxt) release rates were then determined. n = 10 mice per group. Data are presented as means ± SEM (B, F). *p < 0.05, two-tailed Student’s t-test (B, F).
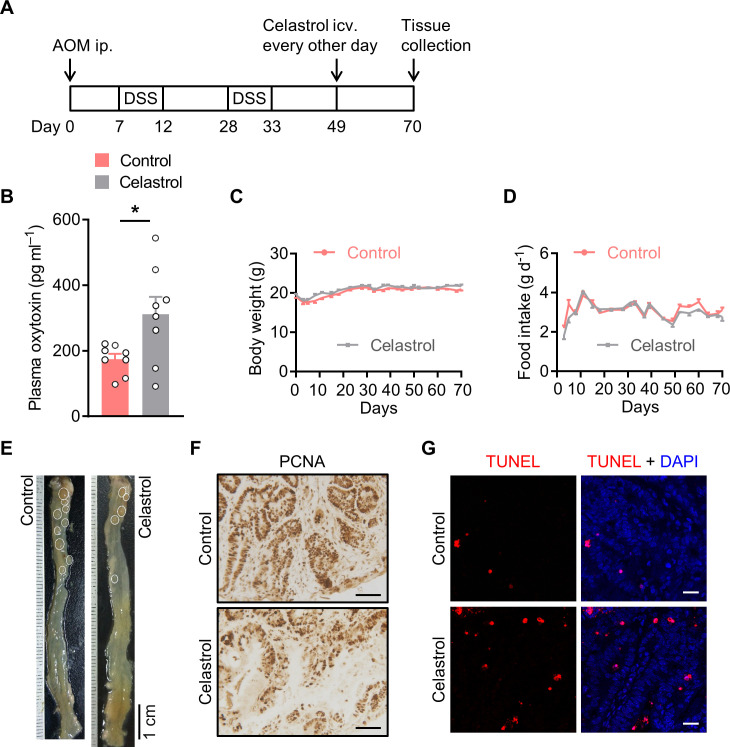
Figure 4—figure supplement 2. Brain treatment with celastrol suppresses colitis-associated cancer (CAC) progression in mice.

Figure 4—figure supplement 2.

(A) Schematic diagram of the experimental design. The CAC was induced in the male C57 BL/6 mice (2 months of age) using azoxymethane (AOM) and dextran sodium sulfate (DSS). These mice were then i.c.v. administered with vehicle versus celastrol every other day for 3 weeks. (B) The plasma oxytocin (Oxt) levels at the end of the experiment. n = 8 mice per group. (C and D) The body weight (C) and food intake (D) in mice throughout the experiment. n = 10 (control) or 8 (celastrol) mice per group. (E) Representative images of the colorectal tissue. White eclipses outline individual tumor. (F) Immunohistochemical staining for proliferating cell nuclear antigen (PCNA) of tumor tissues. Scale bars, 50 μm. (G) Terminal deoxynucleotidyl transferase dUTP nick end labeling (TUNEL) assay of tumor tissues. TUNEL labeling is shown in red. Cell nuclei were counterstained with DAPI (blue). Scale bars, 20 μm. Data are presented as means ± SEM. *p < 0.05, two-tailed Student’s t-test (B).