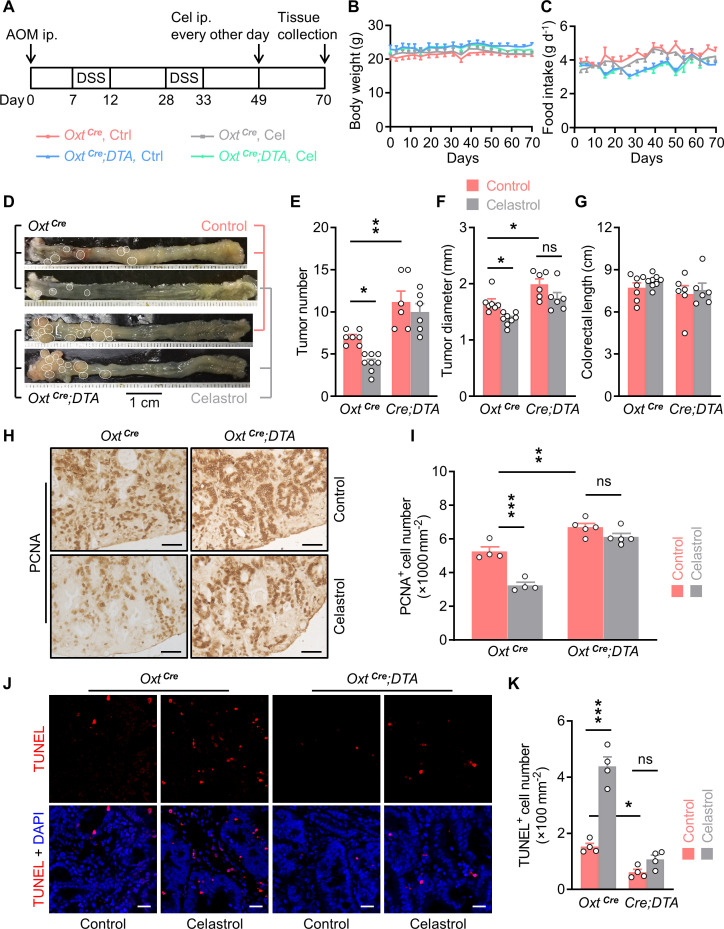
Figure 5. Depletion of oxytocin (Oxt) neurons attenuates the anti-tumor effect of celastrol.
(A) A schematic diagram of experimental design. The colitis-associated cancer (CAC) was induced in the OxtCre and OxtCre;DTA mice (2 months of age), in which control solution and celastrol (Cel) were i.p. administered every other day for 3 weeks. (B and C) Body weight (B) and food intake (C) in mice throughout the experiment. n = 7 (OxtCre, Ctrl), 8 (OxtCre, Cel), or 6 (OxtCre;DTA) mice per group. (D) Representative images of colorectal tissue after the indicated treatments. White eclipses indicate individual tumor. (E and F) Tumor number (E) and diameter (F). Cre;DTA, OxtCre;DTA. ns, not significant. n = 7 (OxtCre, Ctrl), 8 (OxtCre, Cel), or 6 (OxtCre;DTA) mice per group. (G) Colorectal length. n = 7 (OxtCre, Ctrl), 8 (OxtCre, Cel), or 6 (OxtCre;DTA) mice per group. (H and I) Immunohistochemical staining for proliferating cell nuclear antigen (PCNA) of tumor tissue. Representative images (H) and the density of PCNA-positive cells (I) are shown. ns, not significant. Scale bars, 50 μm. n = 4 (OxtCre) or 5 (OxtCre;DTA) mice per group. (J and K) Terminal deoxynucleotidyl transferase dUTP nick end labeling (TUNEL) assay of tumor tissue. Representative images (J) and the density of TUNEL-positive cells (K) are shown. TUNEL labeling is in red. Cell nuclei were counterstained with DAPI (blue). ns, not significant. Scale bars, 20 μm. n = 4 mice per group. Data are presented as means ± SEM. *p < 0.05, **p < 0.01, ***p < 0.001, one-way ANOVA with Bonferroni’s post hoc test (E, F, I, K).

