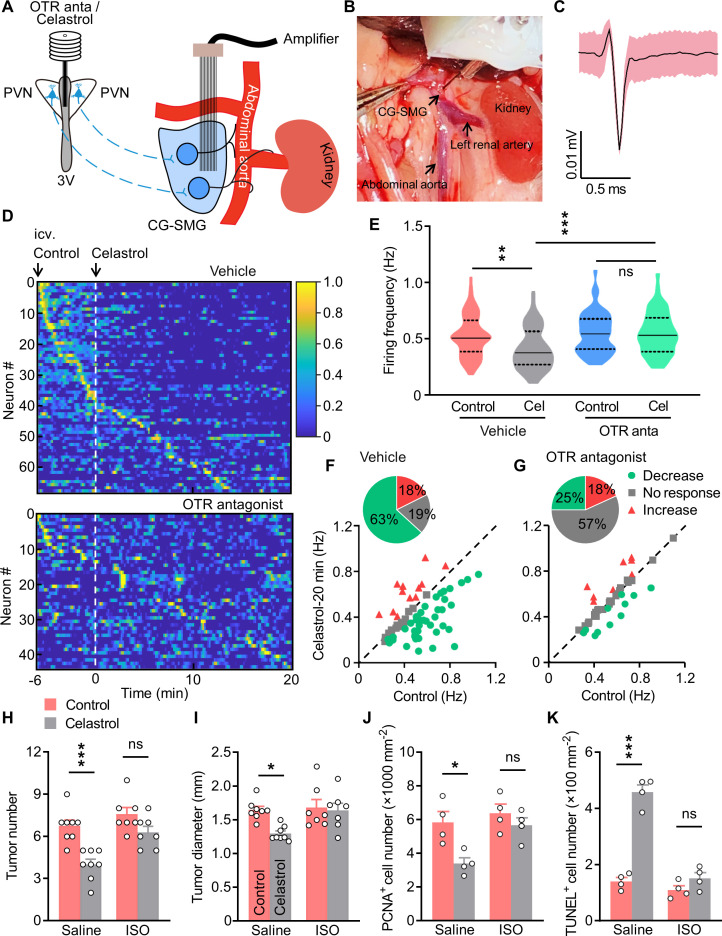
Figure 7. Treatment with isoprenaline abolished the anti-tumor effect of celastrol.
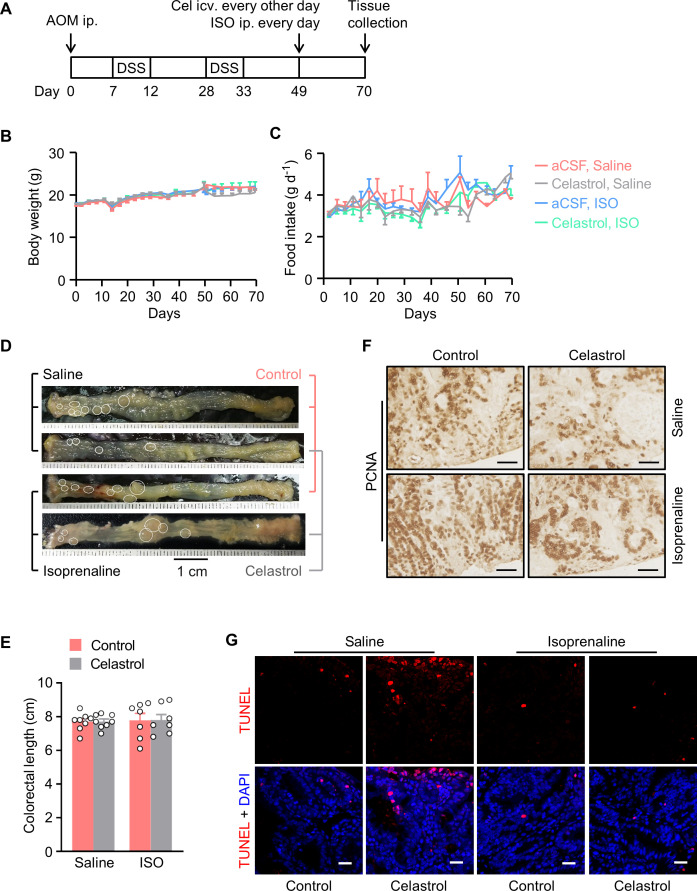
(A) Schematics of in vivo single-unit recordings in celiac-superior mesenteric ganglion (CG-SMG). L-368,899, the Oxt receptor (OTR) antagonist (OTR anta), and celastrol were applied through a guide cannula directed to third ventricle (3V). (B) A CG-SMG image was taken during the operation. (C) Example waveform of the single unit detected. (D) Normalized firing rate of recorded CG-SMG neurons in response to celastrol infusion in vehicle (top) and OTR antagonist (bottom) groups. Dashed line indicates the time point of celastrol delivery. i.c.v., intracerebroventricular injection. n = 68 cells (vehicle) from 7 mice or 44 cells (OTR antagonist) from 6 mice. (E) Statistics of average firing frequency of CG-SMG neurons in response to celastrol infusion in vehicle and OTR antagonist groups. Solid and dotted lines indicate medians and quartiles, respectively. n = 68 cells (vehicle) from 7 mice or 44 cells (OTR antagonist) from 6 mice. (F and G) Correlation of firing rate before and after celastrol infusion in vehicle (F) and OTR antagonist (G) groups. Green filled circles represent individual units with significantly lower firing frequency after celastrol infusion. Red triangles represent the units with higher firing rates. Gray squares indicate neurons without significant difference in firing rates. Inset: proportions of CG-SMG neurons with significantly decreased rates, increased rates, or no change in rates after celastrol infusion in vehicle (F) and OTR antagonist group (G). n = 68 cells (vehicle) from 7 mice or 44 cells (OTR antagonist) from 6 mice. (H and I) Colitis-associated cancer (CAC) was induced in male C57 BL/6 mice (2 months of age). These mice were then i.c.v. administered with vehicle (control) or celastrol every other day. In the meantime, the mice were i.p. injected with saline or isoprenaline (ISO) on a daily basis. These treatments were continued for 3 weeks (see also Figure 7—figure supplement 2A). Tumor number (H) and diameter (I) are shown. ns, not significant. n = 8 (saline) or 7 (ISO) mice per group. (J) The density of proliferating cell nuclear antigen (PCNA)-positive cells in tumor tissue. ns, not significant. n = 4 mice per group. (K) The density of terminal deoxynucleotidyl transferase dUTP nick end labeling (TUNEL)-positive cells in tumor tissue. ns, not significant. n = 4 mice per group. Data are presented as means ± SD (C) or means ± SEM (H–K). *p < 0.05, **p < 0.01, ***p < 0.001, one-way ANOVA with Bonferroni’s post hoc test (E, H–K).


