. 2021 Sep 29;10:e71351. doi: 10.7554/eLife.71351

Figure 5. Elevated circulating markers of endothelial cell (EC) activation and damage in Vivaxhigh compared to Vivaxlow patients.

(A) Endothelial changes across clusters: Luminex. Heatmap represents z-scores obtained by centering values of Luminex data. Shown are markers of EC activation, procoagulation, and glycocalyx damage. Each column (each individual) in the heatmap is matched with colour-coded cluster assignment: Cluster Control – green bar; Cluster Vivaxlow – blue bar; and Cluster Vivaxhigh – red bar. (B) Endothelial changes across clusters: qRT-PCR. Transcriptional response of human umbilical vein endothelial cells (HUVECs) incubated for 6 hr with 30% v/v pooled plasma from different clusters. Heatmap reflects relative mRNA expression intensity (average scaled value) after results were normalized to GAPDH housekeeping gene expression and untreated condition (mock). Data shown represent the mean of three independent experiments. For each experiment, two technical replicates were performed for each condition. (C) Endothelial changes across clusters: impedance changes. Endothelial monolayer integrity was measured during 20% v/v of pooled plasma incubation. Each line represents the mean ± SD of normalized resistance of HUVECs measured by electric cell-substrate impedance sensing (ECIS) at 4000 Hz. Data shown are representative of three independent experiments. For each experiment, two technical replicates were performed for each condition. (D) Endothelial changes across clusters: imaging and flow cytometry. HUVECs were incubated for 18 hr with 30% v/v of pooled plasma of individuals in the different clusters or left untreated (mock). Percentage of cells expressing EC activation markers (adhesion molecules) ICAM and VCAM as well as quantification of protein expression was determined by flow cytometry and immunofluorescence analysis (scale bar = 33 μM). Isotype antibodies were used as control to define positive populations. Significance was calculated for comparisons between conditions at the corresponding time point . One-way analysis of variance statistical test with Tukey’s corrected multiple comparisons test was performed. p-Value is indicated above the graph when p<0.05. Data shown are representative mean ± SEM of three independent experiments.

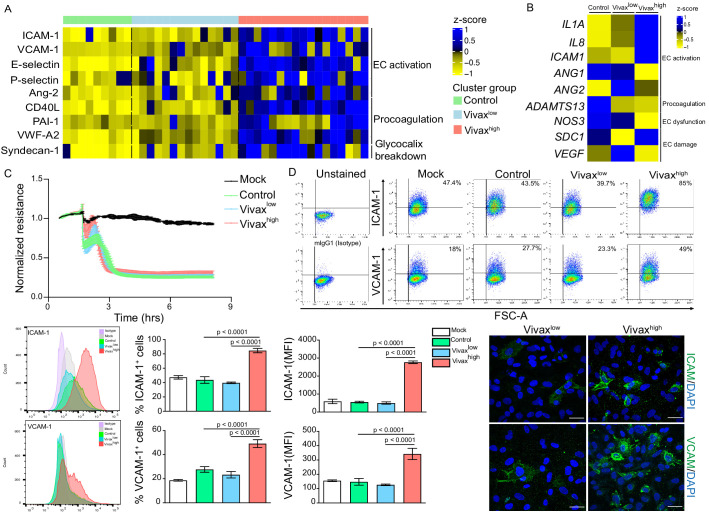
Figure 5.

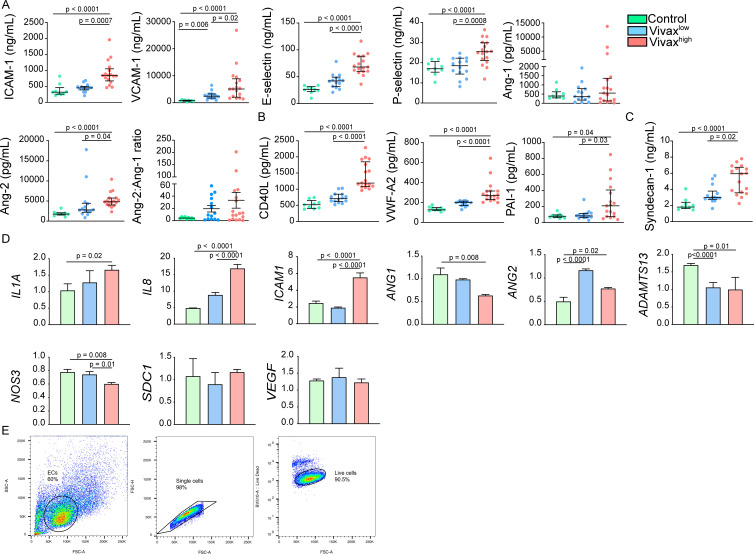
Figure 5—figure supplement 1. Increase of markers of endothelial cell (EC) activation, damage (glycocalyx breakdown), and procoagulation in the plasma of Vivaxhigh patients.

Figure 5—figure supplement 1.

(A) Levels of EC activation markers, (B) procoagulant phenotype, and (C) EC damage (glycocalyx breakdown) in the acute-phase patients’ plasma samples of our cross-sectional cohort in Manaus, Brazil, were determined by multiplex bead-based assay (Luminex): Control (healthy donors, n = 9), Vivaxlow patients (n = 14), and Vivaxhigh patients (n = 17), as indicated in the legend (top-right corner). Biomarkers’ concentration is depicted as scatter plots showing individual data points and the median (black lines) and the interquartile range. One-way analysis of variance with Bonferroni-corrected multiple comparisons test was performed. p-Value is indicated above the graph when reached significance of p<0.05. (D) Quantitative mRNA expression was determined by qRT-PCR in RNA extracted from human umbilical vein endothelial cells (HUVECs) incubated for 6 hr with 30% v/v pooled plasma of individuals in the different clusters, as indicated in the legend (top-right corner). Graphs depict relative expression after results were normalized to GAPDH housekeeping gene expression. The data shown are mean ± SEM representative of three independent experiments. Significance was calculated for comparisons between conditions at the corresponding time point using one-way analyies of variance with Tukey’s corrected multiple comparisons test. p-Value is indicated above the graph when reached significance of p<0.05. (E) Schematics of HUVECs gating strategy used for flow cytometry analysis. EC gate was defined based on the cells’ forward scatter (FSC) and side scatter (SSC). Further, gated single cells on FSC-A vs. FSC-H scatter plot and selected live cells based on Fixable Viability Dye eFluor 506 staining.
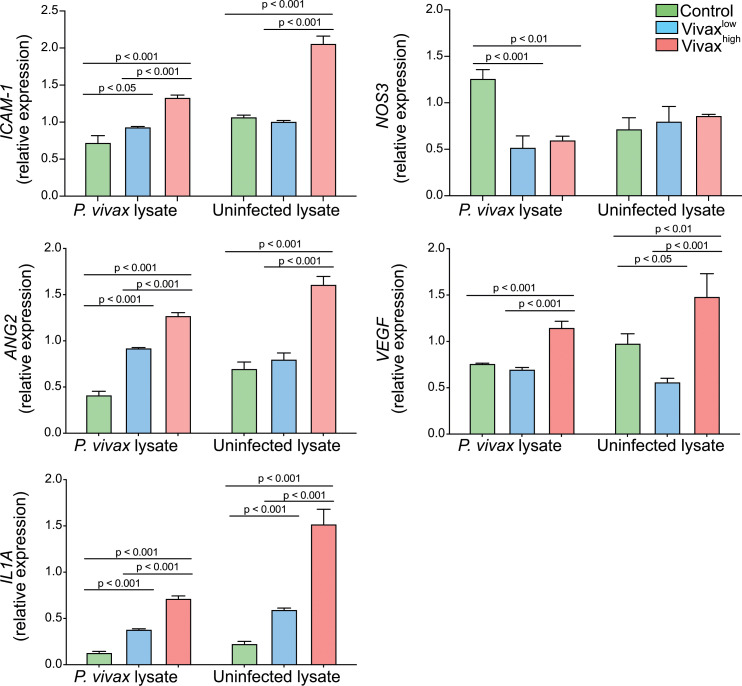
Figure 5—figure supplement 2. Haemolysis potentiates Vivaxhigh-induced endothelial cell (EC) activation.

Figure 5—figure supplement 2.

In order to mimic the environment associated with commencement of antimalarial treatment, such as content released from haemolysis of RBCs and dead parasites by-products, human umbilical vein endothelial cells (HUVECS) were stimulated with either P. vivax-infected (schizont enriched) or uninfected RBCs lysates in 30% v/v pooled plasma of individuals in the different clusters. For the parasite lysates, batch pellets of P. vivax infected RBCs (iRBCs) enriched of schizonts, isolated from blood of P. vivax-infected patients using Percoll gradient centrifugation, and healthy donor RBCs were stored at −80°C without any cryopreservative agent. Pellets were twice freeze-thawed for use as whole lysates. Total RNA was extracted 6 hr after treatment and relative mRNA expression determined by real-time quantitative PCR. Graphs depict relative expression after results were normalized to GAPDH housekeeping gene expression. The data shown are mean ± SEM representative of three independent experiments. Significance was calculated for comparisons between conditions at the corresponding time point using one-way analysis of variance with Tukey’s corrected multiple comparisons test. p-Value is indicated above the graph when reached significance of p<0.05. Haemolysis of either P. vivax-infected or uninfected RBCs potentiates the effect of Vivaxhigh pooled plasma in inducing transcriptional upregulation of EC activation markers. Different from the stimulation only with plasma, in the presence of haemolysis, we also observed upregulation of Ang-2 and VEGF, and downregulation of NOS3, markers associated with perturbation of the vascular integrity and function.