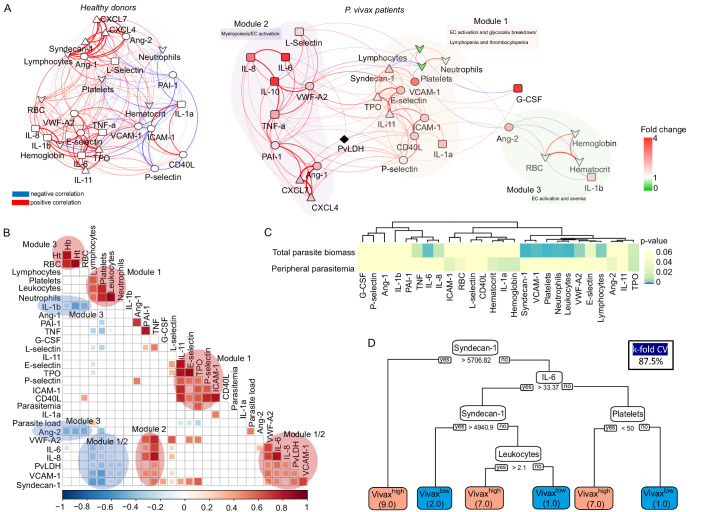
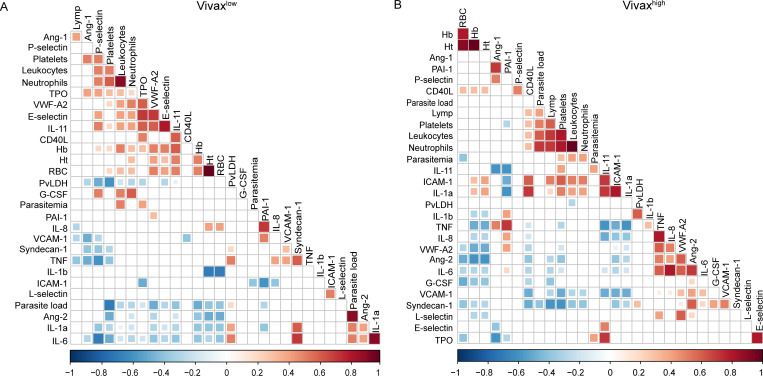
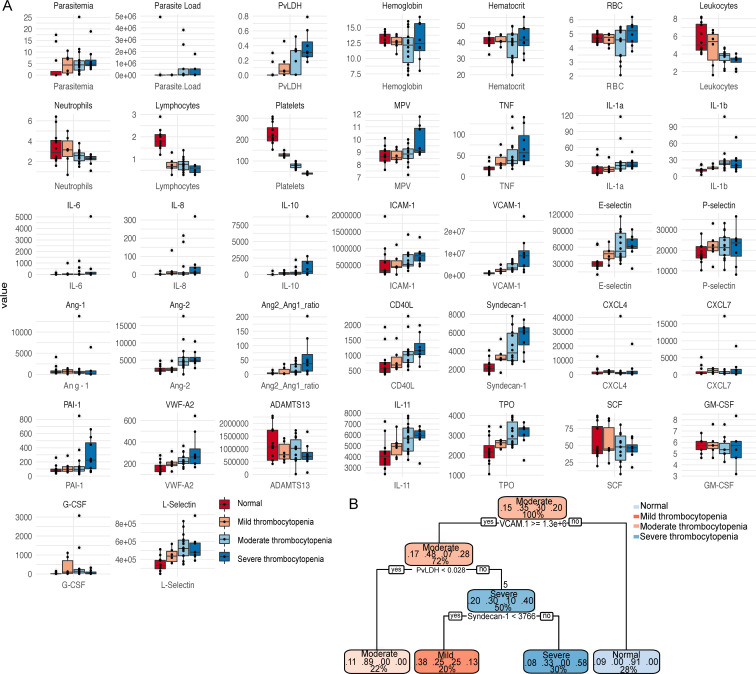
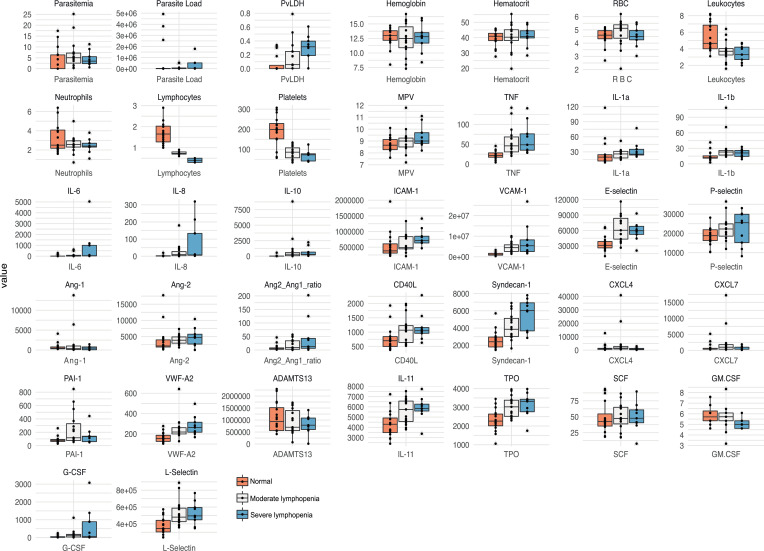
Figure 6. Network analysis and clustering of parasite and host signatures indicate parasite-induced changes in deep tissues.
(A) Network analysis. Networks of the Pearson’s correlations (absolute coefficient above 0.5 and p-value<0.05) between parasite biomass (P. vivax lactate dehydrogenase [PvLDH]) and host signatures in healthy donors (left graph) and in P. vivax-infected patients (right graph), using a force-directed layout. The symbols of the nodes represent biological functions: triangle represents markers of platelet activation and thrombopoiesis-inducing cytokines; V shape represents haematological parameters (neutrophil, lymphocyte, and platelet counts); circles represent endothelial cell activation markers; squares represent myelopoiesis-inducing cytokines and neutrophil activation markers. The colours in the nodes represent the fold change in relation to control levels. Because healthy donors do not have parasitaemia, PvLDH node is represented in black. Each connecting line (edge) represents a significant interaction detected by the network analysis using R. Correlation strength is represented by edge colour transparency and width. Positive correlations are represented by red edges, and negatives correlations are represented by blue edges. (B, C) Correlation matrix and heatmap. (B) Representative image of Pearson’s correlation matrix calculated for all P. vivax patients. Only correlations with p-value<0.01 are shown, and hierarchical clustering was applied. Red circles highlight positive correlations in the functional modules depicted in (A), and blue circles highlight negative correlations in the functional modules also depicted in (A). (C) Heatmap showing p-values of the correlations between different parasite parameters, parasite biomass (PvLDH), and peripheral parasitaemia and host signatures (haematological and Luminex parameters). (D) Decision tree model. Best-fit classification tree model generated with the C4.5 algorithm showing Syndecan-1, IL-6, and platelet counts are the dominant variables capable of predicting total parasite biomass in P. vivax patients. Cut-off values of the attribute that best divided groups were placed in the root of the tree according to the parameter value (pg/mL for soluble markers or number of cells × 1000/μL of blood for platelet counts). The total of classified registers for each class is given in parentheses for each terminal node with the k-fold cross-validation (k-fold CV) accuracy indicated.


