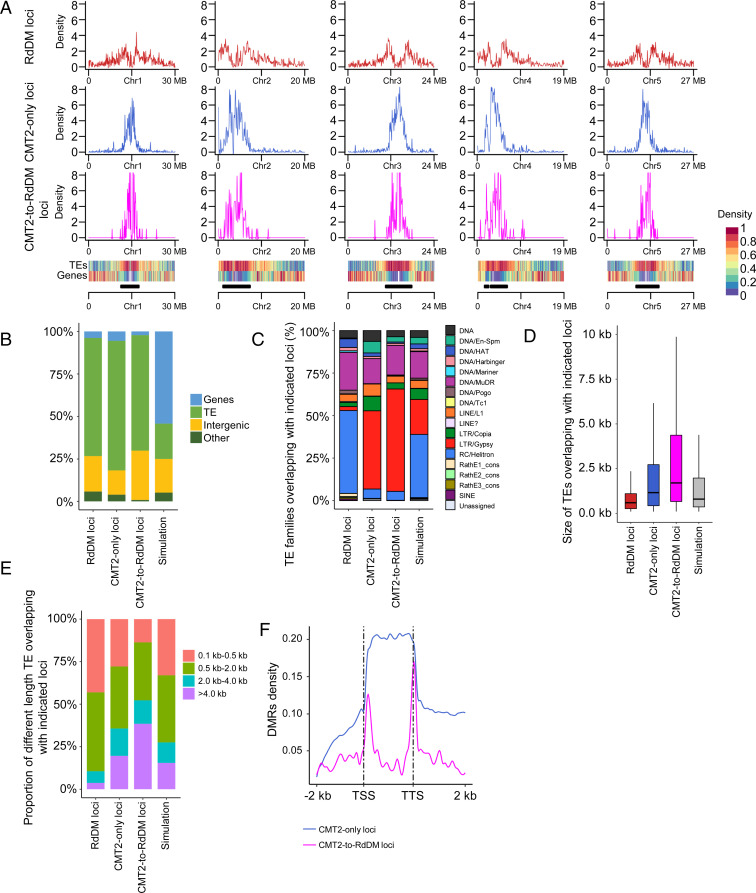
Fig. 2.
Characterization of RdDM, CMT2-only, and CMT2-to-RdDM loci. (A) Distribution of RdDM loci, CMT2-only loci, and CMT2-to-RdDM loci across chromosomes. Heatmaps at the Bottom show the TE and gene densities, respectively. Black bars indicate pericentromeric regions. (B) Composition of the genomic location of the RdDM loci, CMT2-only loci, and CMT2-to-RdDM loci. TE, transposable element. Simulation regions served as control loci (the same in C–E). (C) Distribution of TE families overlapping with RdDM loci, CMT2-only loci, and CMT2-to-RdDM loci. (D) Boxplots of sizes of TEs overlapping with RdDM loci, CMT2-only loci, and CMT2-to-RdDM loci. The horizontal line within the box represents the median; the whiskers extend to 1.5 times the interquartile range; and the lower and upper boundaries of the box represent the first and third quartiles, respectively. (E) Composition of sizes of TEs overlapping with RdDM loci, CMT2-only loci, and CMT2-to-RdDM loci. (F) Distribution of CMT2-only loci and CMT2-to-RdDM loci over TEs of >4 kb.

