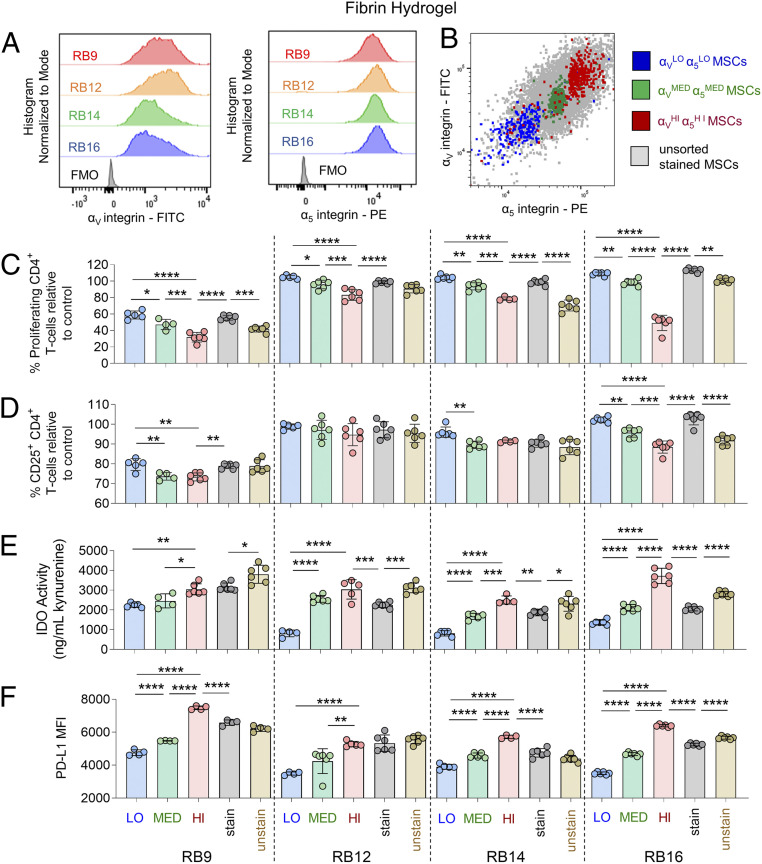
Fig. 6.
Magnitude of αV and α5 integrin subunits identifies MSC subpopulations of varying immunosuppressive capacity with IFN-γ licensing on fibrin hydrogels. (A) FACS plots of αV expression (Left) and α5 expression (Right) of various MSC cell lines. (B) Representative FACS plot of FACS-sorted αVLOα5LO-expressing MSCs, αVMEDα5MED-expressing MSCs, and αVHIα5HI-expressing MSCs and unsorted MSCs. (C) The percent proliferating and (D) CD25+ CD4+ T cells in the presence of FACS-sorted or unsorted MSCs lines with IFN-γ licensing, cultured on fibrin. (E) Activity of IDO and (F) mean fluorescence intensity (MFI) of PD-L1 of FACS-sorted or unsorted MSCs lines with IFN-γ licensing, cultured on fibrin. Labels for groups in C–F are shown in F, where “LO” denotes αVLOα5LO-expressing MSCs, “MED” denotes αVMEDα5MED-expressing MSCs, “HI” denotes αVHIα5HI-expressing MSCs, “stain” denotes unsorted MSCs stained with FACS-sorting antibodies, and “unstain” denotes unsorted, unstained MSCs. n = 4 to 6 for all data sets. Data are presented as means ± SD. Significance is denoted by *P ≤ 0.05, **P ≤ 0.01, ***P ≤ 0.001, or ****P ≤ 0.0001 by one-way ANOVA with Tukey’s post hoc test; separate comparisons were made between conditions of each cell line.

