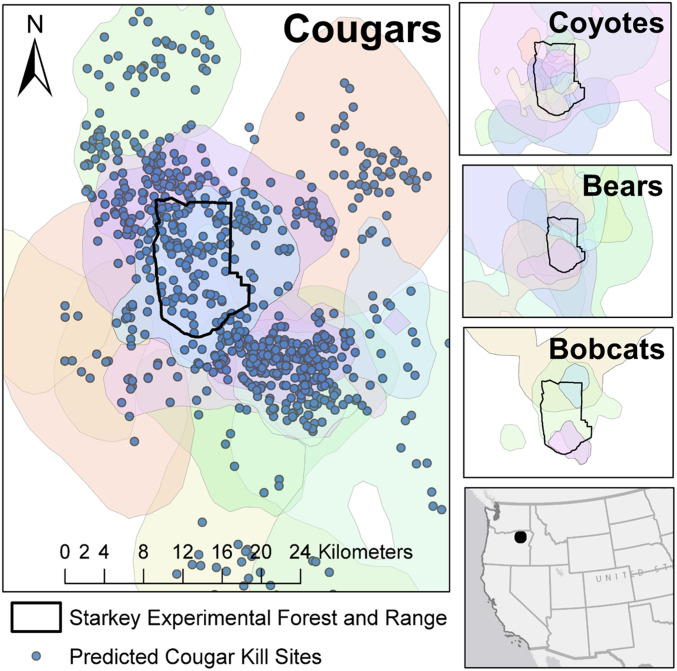
Fig. 2.
Study area. (Left) Known and predicted cougar kill sites (blue points) and 95% kernel density home range estimates (colored polygons) for collared cougars. (Right, Top to Bottom) Coyote, black bear, and bobcat 95% kernel density home range estimates (colored polygons). All panels: Starkey Experimental Forest and Range (black polygon). Kernel density estimates were calculated using the kernelUD function in the adehabitatHR package (53) in program R. We used the default ad hoc smoothing parameter, which assumes the kernel is bivariate normal (53).

