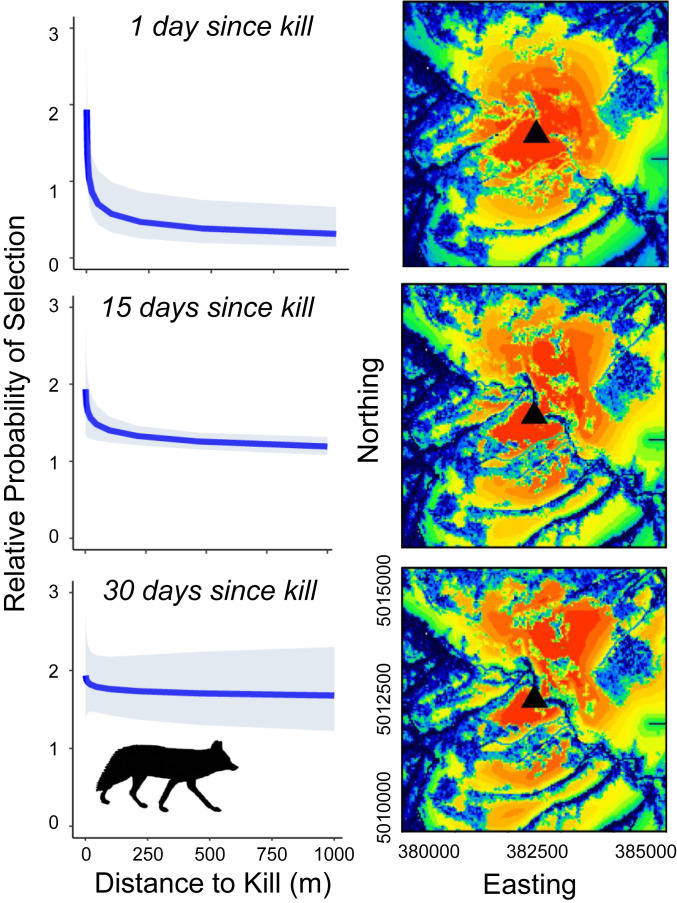
Fig. 3.
Attraction of coyotes to cougar kill sites. The first column presents marginal response plots for SSFs showing the relative probability of selection as a function of the distance to the kill site. The second column presents predictive maps showing the relative probability of selecting for areas on the landscape as a function of the distance to the nearest kill site (black triangle). Warm colors indicate selection, and cool colors indicate avoidance. In both columns, each row shows the predicted response at 1, 15, and 30 d after the kill was made.

