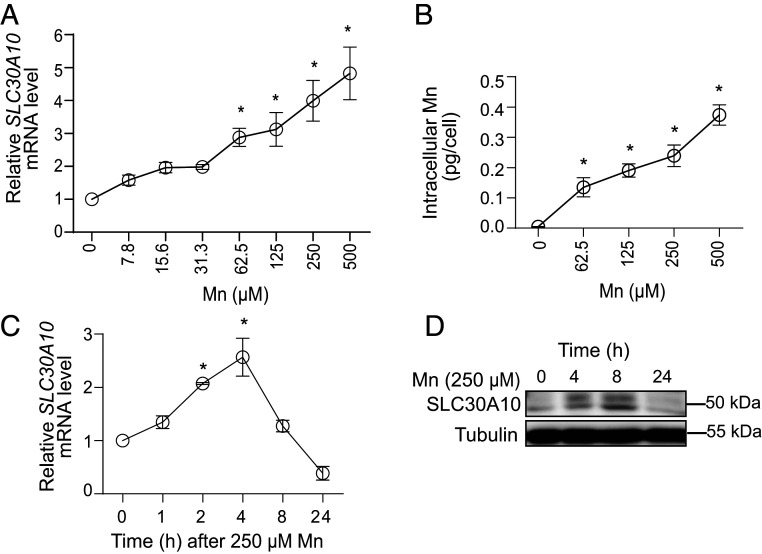
Fig. 2.
Mn up-regulates SLC30A10 expression in HepG2 cells. (A–C) qRT-PCR analyses (A and C) or intracellular Mn levels (B). In A and B, Mn treatment was for 4 h at indicated concentrations. In C, Mn was used at 250 µM for indicated times. Expression without Mn treatment is normalized to 1 in A and C. n = 3 for A and C, and n = 4 for B. Mean ± SE, *P < 0.05 by one-way ANOVA and Dunnett’s post hoc test for the comparison between no Mn and other conditions. (D) Immunoblot assays after treatment with 250 µM Mn for indicated times.

