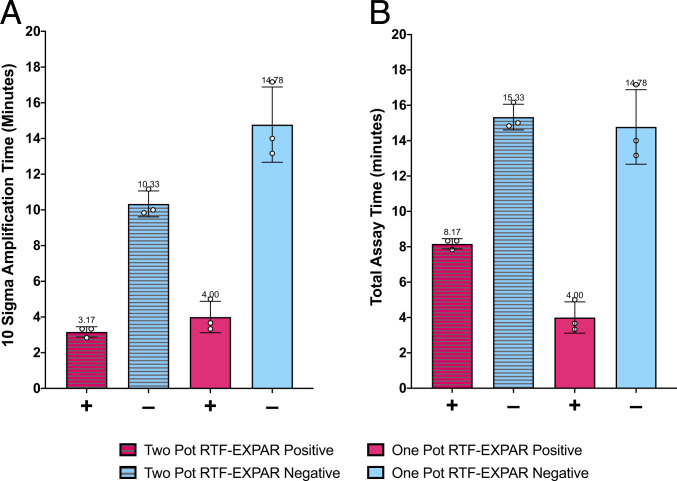
Fig. 2.
RTF-EXPAR assay data (Protocol 1, Sample Batch 1) for SARS-CoV-2 RNA detection (73 copies per µL, n = 3), showing (A) the mean time for the amplification reaction only and (B) the mean total assay time from RNA sample to signal. Each run time was calculated to be the point at which the fluorescence signal was greater than 10 SDs from the baseline signal (10-sigma time). Error bars in datasets are the SDs of the 10-sigma time. Signals observed for negative samples at >10 min are attributed to amplification arising from nonspecific interactions.

