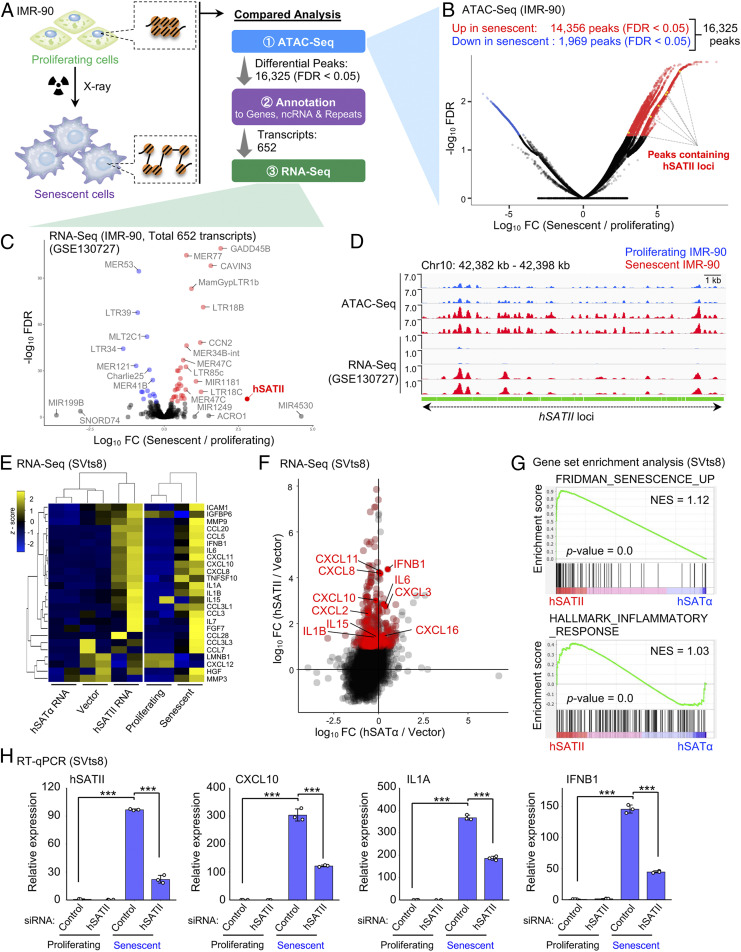
Fig. 1.
Pericentromeric hSATII RNA regulates SASP factor gene expression during cellular senescence. (A–C) Screening of unique transcripts showing increased chromatin accessibility and active transcription during X-ray–induced senescence in IMR-90 cells. (A) A scheme of the screening steps. (B) Volcano plot of ATAC-seq signals showing fold change (FC) (x-axis) and FDR (y-axis) of chromatin accessibility between proliferating and X-ray–induced senescent IMR-90 cells. Red peaks show significantly increased chromatin accessibility in X-ray–induced senescent cells. Blue peaks showing significantly increased chromatin accessibility in proliferating cells. Black peaks show no significant changes. Yellow peaks containing hSATII loci show significantly increased chromatin accessibility. (C) Volcano plot of RNA-seq data (GSE130727) showing FC (x-axis) and FDR (y-axis) concerning 652 transcripts involved in an increased chromatin accessibility region between proliferating and X-ray–induced senescent IMR-90 cells from ATAC-seq analysis in B. The 47 transcripts showing FDR < 1010 are shown as red (up-regulated) or blue (down-regulated) dots. (D) Peaks of uniquely mapped reads by ATAC-seq and RNA-seq (GSE130727) in hSATII loci in proliferating or X-ray–induced senescent IMR-90 cells. Two biological replicates are shown. (E–G) RNA-seq analysis of hSATα– or hSATII-overexpressed and X-ray–induced senescent SVts8 cells. (E) Heatmap regarding SASP-related gene expression in hSATα– or hSATII-overexpressed and X-ray–induced senescent SVts8 cells. (F) Scatterplot showing FC in hSATα (x-axis) or hSATII (y-axis) RNA-overexpressed SVts8 cells compared to empty vector–expressed cells. Red dots indicate genes up-regulated (FC > 10) in vicinity of specific chromatin accessible peaks in hSATII RNA–overexpressed cells. (G) Gene set enrichment analysis of signatures associated with senescence (Upper) and inflammatory response (Lower) in hSATα– or hSATII RNA–overexpressed SVts8 cells. NES, normalized enrichment score. (H) The effect of hSATII RNA knockdown on hSATII RNA and SASP gene expression in proliferating or X-ray–induced senescent SVts8 cells by RT-qPCR. The relative expression is shown as the FC from control small-interfering RNA–treated proliferating cells. Each bar represents mean ± SD of three biological replicates. ***P < 0.001 by one-way ANOVA, followed by the Tukey’s multiple comparisons post hoc test.

