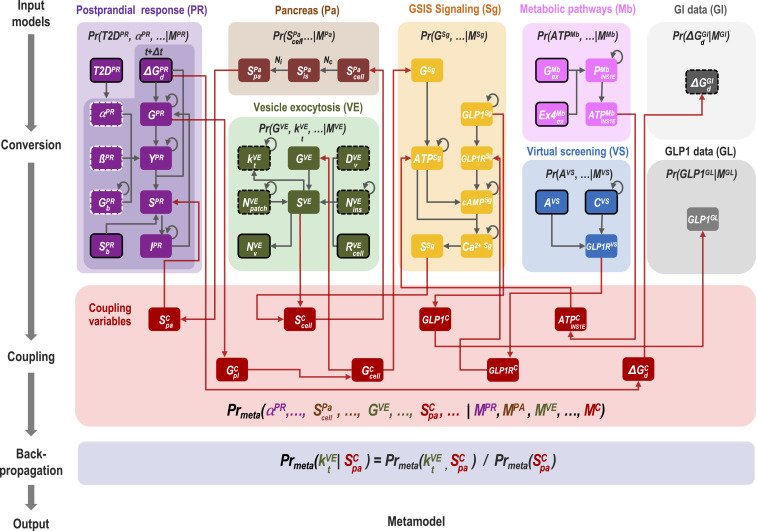
Fig. 2.
From input models to coupled surrogate models in a metamodel of GSIS. Nodes indicate variables, and directed edges indicate probabilistic relations between a parent and child variable in a BN; a child variable is conditionally independent of any of its nondescendants, given the values of its parent variables (19). Each model and its variables are indicated by a specific color. Reference variables are in red, data variables are in gray, fixed parameters in the input models are encircled in white dashed lines, free parameters are encircled in black dashed lines, independent variables are encircled in continuous line, and dependent variables are not encircled. Gray edges are defined by the input models, whereas red edges are defined by the couplers. Self-loops indicate dependency on the value of the same variable in a previous time slice. Annotated variables and edges indicate examples discussed in the text.

