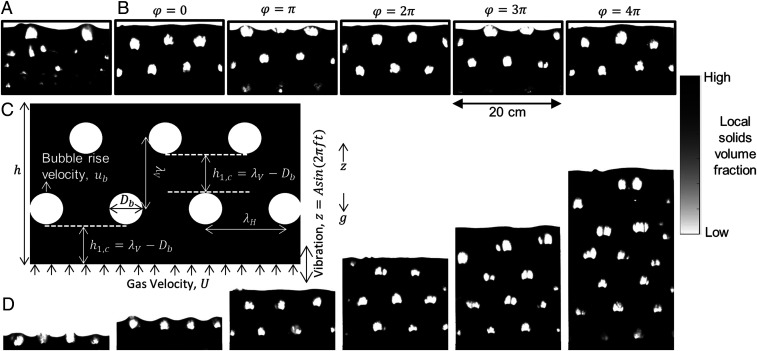
Fig. 2.
Vibration-induced structured bubbling: Optical images of bubbling patterns under different flow conditions: (A) Bubbling with no system vibration and (B) bubbling with system vibration with an initial bed height of 10 cm. C shows schematically how gas flow and vibration are used, as well as the relevant length scales in the system. D shows optical images of bubbling with system vibration with different initial bed heights. The particles used are glass beads with ρp = 2,500 kg/m3 and dp = 212–300 μm. The time interval between two consecutive images in B is 0.1 s, half of the vibration period. From Left to Right, the initial bed height in D is 2.5, 5, 10, 15, 20, and 30 cm. The vibration frequency is 5 Hz and the vibration amplitude is 4.5 mm for B and D. U/Umf is 1.42 for A, B, and D.

