Fig. 1.
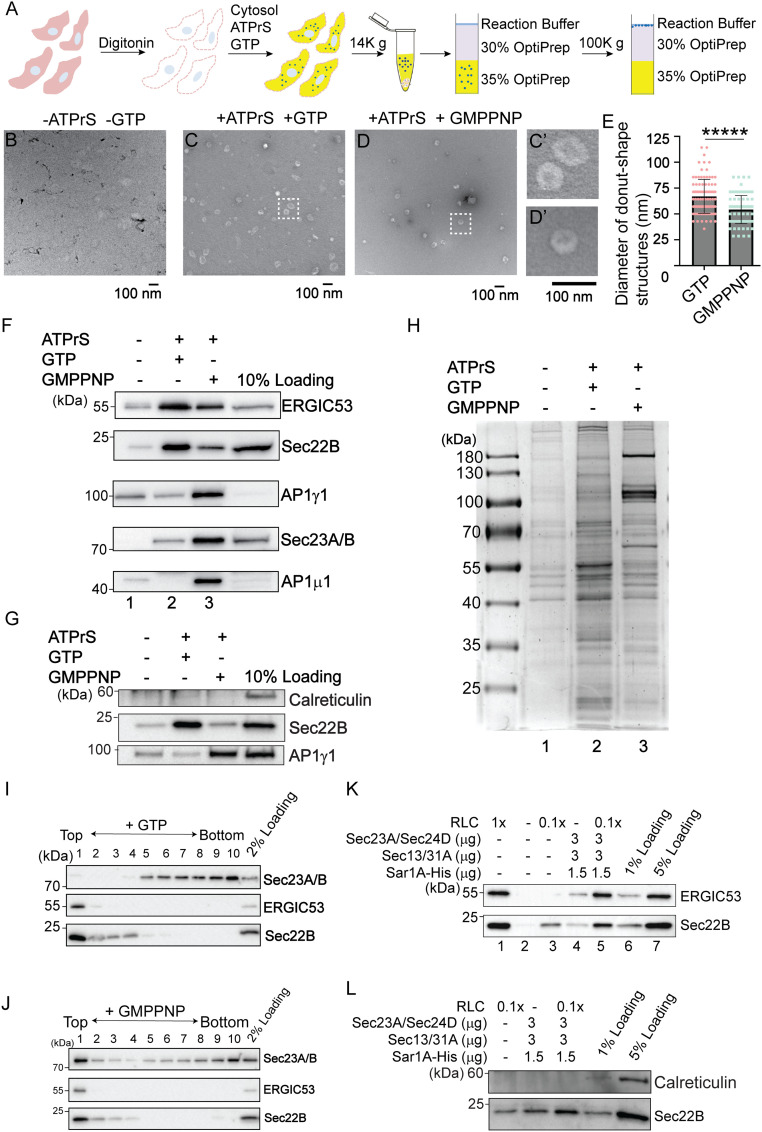
A large-scale in vitro vesicle formation assay for proteomic analysis. (A) Diagram demonstrating the experimental procedures for the vesicle formation assay. (B–D) Visualization of the morphology of the buoyant membrane structures formed in the budding reaction. The buoyant membranes were isolated by density gradient flotation and analyzed by negative staining TEM. (C′ and D′) The magnified views of the indicted areas in C and D. (Scale bar, 100 nm.) (E) Quantification of the diameter of donut shape structures from three biological repeats (mean ± SD *****P < 0.00001). (F–H) The vesicle formation assay was performed using the indicated reagents. Vesicle fractions were analyzed by immunoblot (F and G) or Coomassie blue staining (H). ATPrS: ATP regeneration system. (I and J) The vesicle formation assay was performed in the presence of GTP (I) or GMPPNP (J). The vesicle fractions were evaluated by density gradient flotation. (K and L) The vesicle formation assay was performed using the indicated reagents. The vesicle fraction was analyzed by immunoblot using the indicated antibodies. Data shown in F, G, and K are representative example of three biological repeats.

