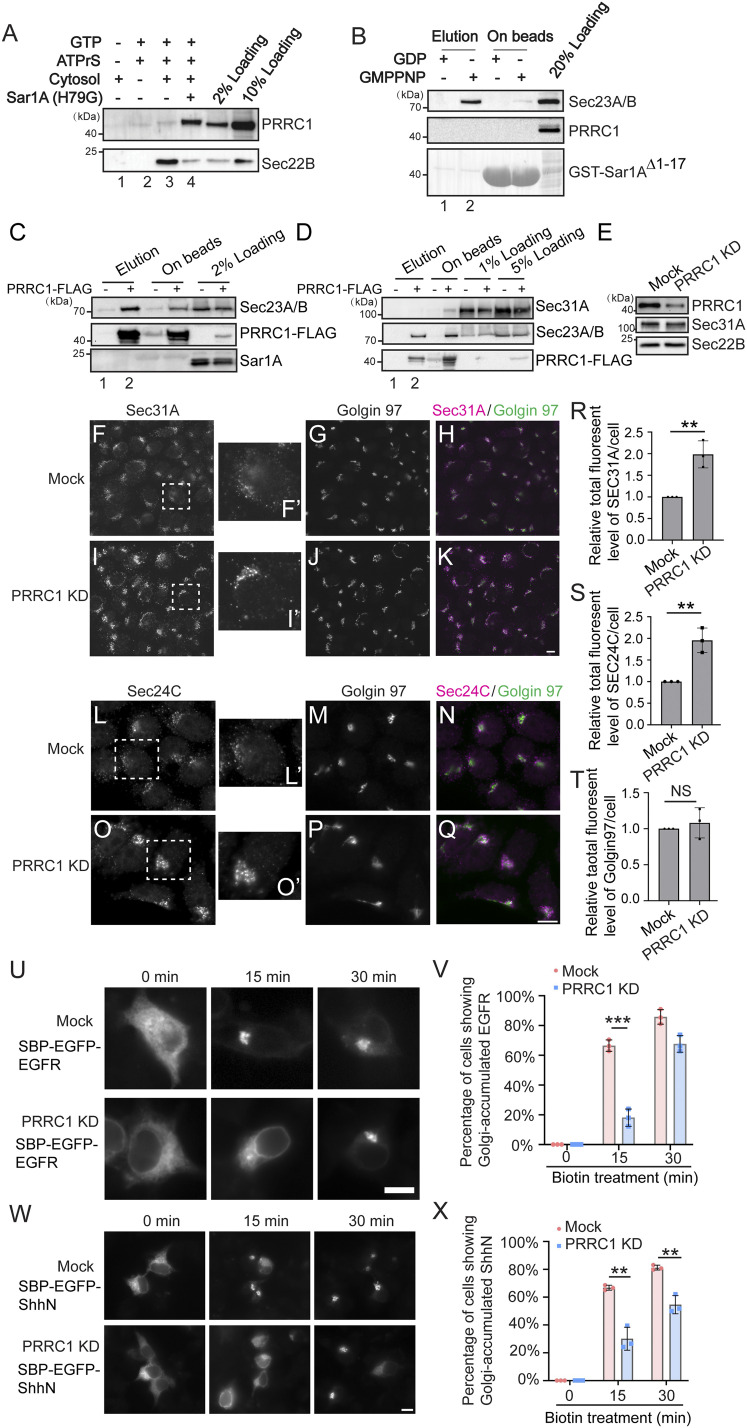
Fig. 5.
PRRC1 interacts with Sec23A/B and knockdown increases membrane association of Sec31A and Sec24C and decreases ER-to-Golgi transport of EGFR and ShhN. (A) The vesicle formation assay was performed using the indicated reagents. Vesicle fractions were analyzed by immunoblot. (B) GST-Sar1AΔ1–17 was loaded with GDP or GMPPNP and then incubated with rat liver cytosol. After incubation, proteins that bound to Sar1A in a nucleotide-dependent manner were eluted with EDTA. The eluted fraction and the proteins left on beads after elution were analyzed by immunoblot. (C and D) M2 agarose beads were incubated with cell lysates from HEK293T cells expressing the PRRC1-FLAG. After incubation, the bound proteins were eluted with 3× FLAG peptides and analyzed by Western blot using the indicated antibodies. (E) HEK293T cells were transfected with control siRNA or siRNA against PRRC1. Day 3 after transfection, cells were lysed and analyzed by Western blot. (F–Q) HEK293T cells were transfected with control siRNA (F–H, L–N) or siRNA against PRRC1 (I–K, O–Q). Day 3 after transfection, the localizations of Sec31A, Sec24C, and Golgin97 were analyzed by immunofluorescence. (Scale bar, 10 μm.) The magnified views of the indicated area in F, I, L, and O are shown in F′, I′, L′, and O′. (R–T) Quantifications of the total fluorescent level of Sec31A (R), Sec24C (S), and Golgin97 (T) per cell (mean ± SD; n = 3; >125 cells from nine random imaging fields counted for each experiment). In each experiment, the total fluorescent level was normalized to that in mock cells. **P < 0.01; NS, not significant. (U and W) HEK293T cells were transfected with control siRNA or siRNA against PRRC1. Twenty-four hours after transfection, cells were retransfected with plasmids encoding the indicated construct. On day 3 after knockdown, cells were incubated with biotin for the indicated time and the localization of the indicated protein was analyzed by fluorescent microscope. (Scale bar, 10 μm.) (V and X) Quantifications of the percentage of cells showing Golgi-localized EGFR or ShhN in cells treated with control siRNA or siRNA against PRRC1 (mean ± SD; n = 3; >100 cells counted for each experiment). ***P < 0.001; **P < 0.01. Data shown in A, B, D, and E are representative examples of three biological repeats.

