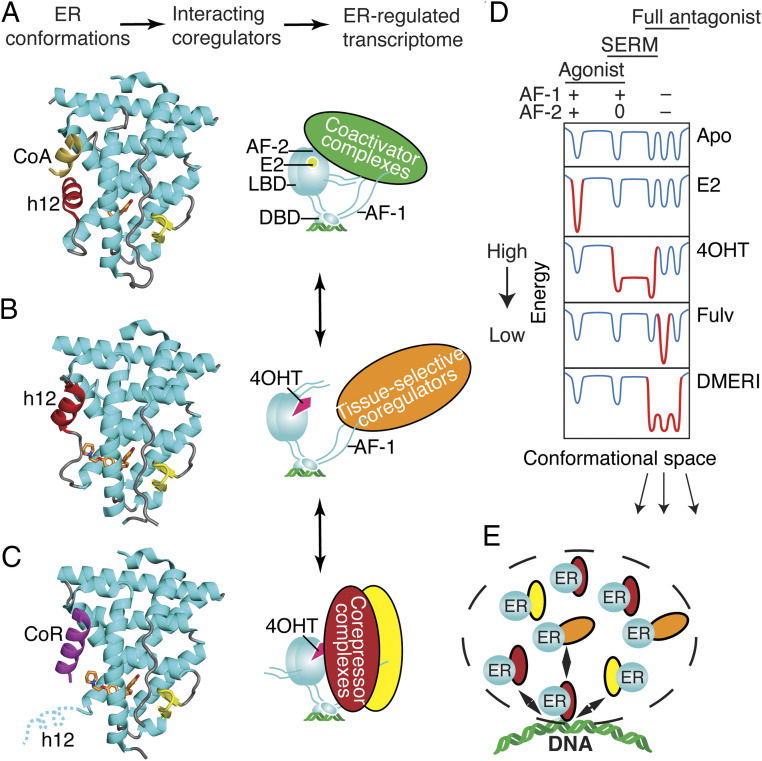
Fig. 6.
Ligand-dependent control of ERα-LBD conformation and of ER coregulator recruitment and selection of activity states. (A) The active LBD conformation (7). (Left) Ribbon diagram of the ER LBD bound to estradiol. Helix 12 (h12, colored red) forms one side of the coactivator binding site, shown here binding to a peptide from Steroid Receptor Coactivator-2 (CoA colored yellow) from PDB entry 3UUD. (Right) Schematic of ERα bound to estradiol (E2), DNA, and a coactivator complex. With full agonists, the coactivator recruitment to the LBD surface, AF-2 nucleates binding of multiprotein coactivator complexes to other domains including AF-1 (Activation Function-1). DBD, DNA binding domain. Steroid Receptor Coactivators (SRCs) 1–3 bind to both AF-1 and AF-2 through separate interactions. (B) The inactive LBD conformer (7, 27). Left, Ribbon diagram of the ER LBD bound to an antagonist. Antagonists can flip h12 (colored red) into the coactivator/corepressor binding site, rendering the LBD inactive by blocking both coactivator and corepressor binding to AF-2, from PDB entry 2QXS. (Right) When h12 blocks both coactivators and corepressors from binding the LBD, the activity of AF-1 is cell-type specific. (C) The transcriptionally repressive LBD conformation (9, 12, 25, 53). (Left) Ribbon diagram of the ER LBD bound to a corepressor peptide, colored violet. When h12 is disordered by an antagonist, the LBD can bind an extended peptide motif found in transcriptional corepressors (8) from PDB entry 2JFA. (Right) Cartoon of ERα bound to 4OHT and a corepressor complex, repressing both AF-1 and AF-2 activity and mediating mediate chromatin compaction and inhibition of proliferative gene expression. (D) Energy diagram illustrating how ER ligands differ in stabilizing, specific, low-energy receptor conformations associated with transcriptional activity (+), inactivity (0), or repression (−) that are being driven by the activity state of AF-2 or AF-1. The dips in the curves represent different LBD conformations associated with the three AF-1/AF-2 activity states shown at the top, leftmost being the active state (a), the rightmost representing substates of the repressive state (b), and the middle the inactive state (c). When a state is stabilized by a particular type of ligand, the curves become deeper, with gray changed to red; the barrier heights between states indicate the ease of dynamic interchange among the states or substates. The DMERI showed multiple mechanisms of antagonism, represented by the multiple-favored repressor substates with reduced exchange barriers. (E) Dashed line indicates a transcriptional phase condensate with multiple receptor–coregulator complexes exchanging at an ER binding site, enabling multiple mechanisms of antagonism.

