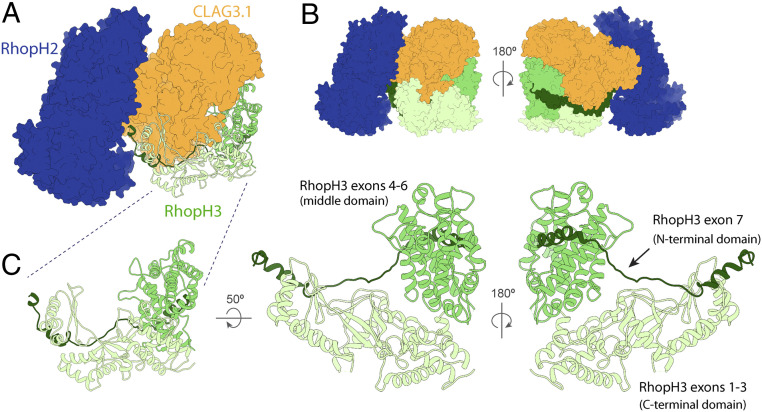
Fig. 3.
Structural details of RhopH3. (A) RhopH3 (ribbon diagram) and RhopH2 and CLAG3.1 (space-filling surface diagram in different blue and orange, respectively) showing the interfaces between RhopH3 and the other components of the RhopH complex. (B) Front and back views showing the arrangement of RhopH3 domains. (C) Multiple views of the RhopH3 N-terminal, middle, and C-terminal domains, corresponding to RhopH3 exons 1 to 3, 4 to 6, and 7, and colored mint, green, and forest, respectively.

