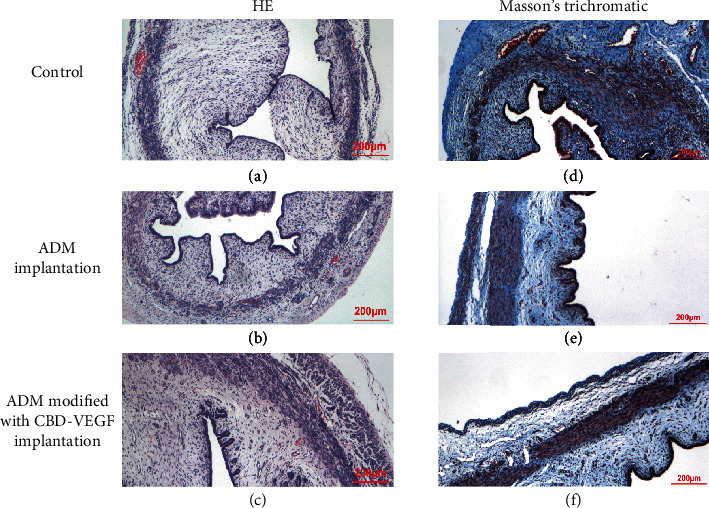
Figure 4.

Representative HE staining (a–c) and Masson's-stained histological images (d–f) of the urethra from the control, ADM, and ADM modified with CBD-VEGF groups. Scale bar = 200 μm. (a–c) Represented the control, ADM, and ADM modified with CBD-VEGF groups, respectively. (d–f) represented the control, ADM, and ADM modified with CBD-VEGF groups, respectively.
