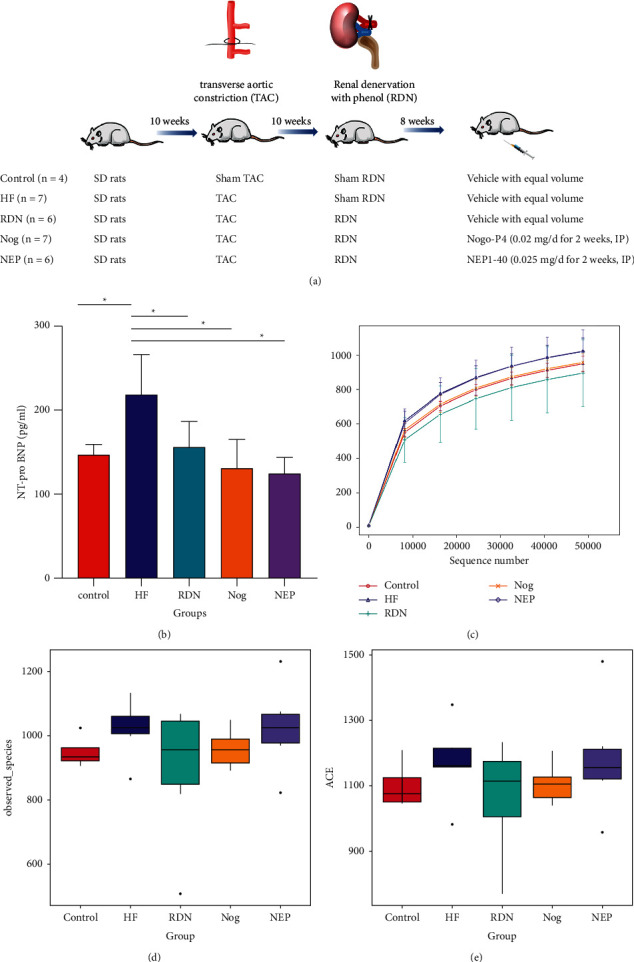
Figure 1.

Schematic diagram of the study and the influence of RDN on plasma N-terminal prohormone brain natriuretic peptide (NT-proBNP) levels and alpha diversity of the gut microbiome. (a) Schematic diagram of the study. (b) Plasm NT-proBNP levels of the control group, the HF group, the RDN group, the Nog group, and the NEP group (∗P < 0.05 vs. the HF group). (c) Rarefaction diversity of different samples based on observed species number. The sequencing depth is given on the x-axis, while the y-axis shows the corresponding operational taxonomic units (OTUs). (d, e) Alpha diversity for various groups based on observed species and abundance coverage estimator (ACE). No significant differences were found between the five groups (P > 0.05).
