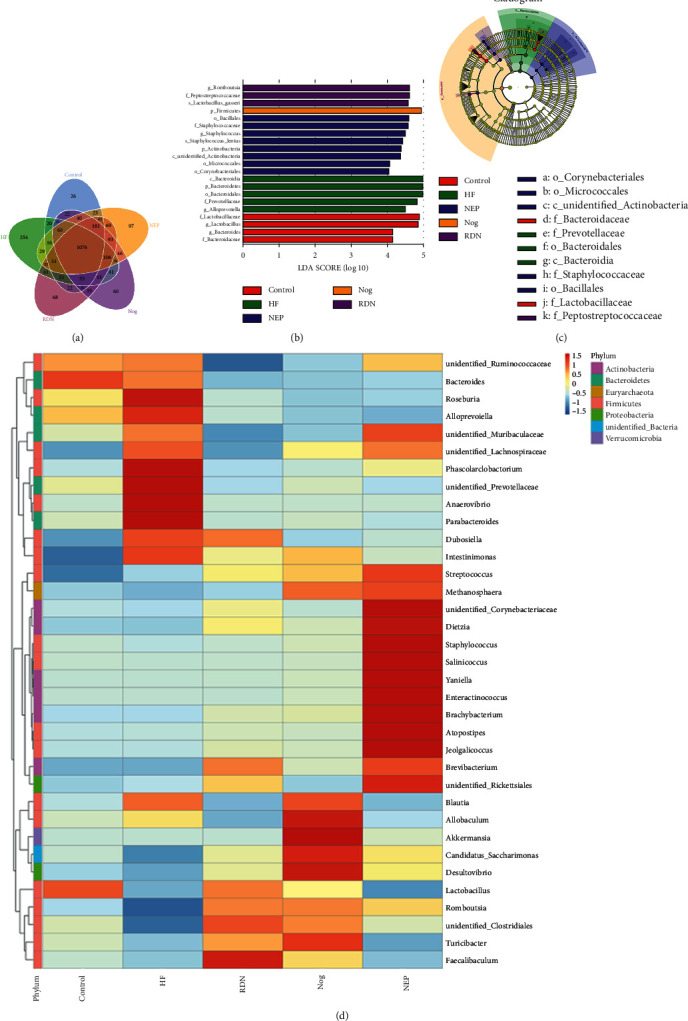
Figure 5.

The results of Venn diagram, LEfSe analysis, and heat map analysis. (a) Venn diagrams and unique operational taxonomic units (OTUs) among the intestinal bacterial communities of the control, HF, RDN, Nog, and NEP groups. (b) The results of linear discriminant analysis effect size (LEfSe). The histogram of the linear discriminant analysis (LDA) score showed the biomarkers with statistics in the control (red), HF (green), RDN (purple), Nog (yellow), and NEP (blue) groups (LDA score ≥4.0). The degree to which species exerted an influence is expressed by the length of the bar in the histogram. (c) Taxonomic cladogram obtained from LEfSe. Taxa meeting a linear discriminant analysis significance threshold >4 are shown (c: class level; f: family level; g: genus level; o: order level; and p: phylum level). Biomarkers were colored by different groups (yellow represented nonsignificant, red indicated the control group, green indicated the HF group, purple indicated the RDN group, yellow indicated the Nog group, and blue indicated the NEP group). Each circle's diameter was proportional to the taxonomic abundance. (d) Heat map of the top 35 genera of relative abundance of rats gut microbes from the control, HF, RDN, Nog, and NEP groups. The relative abundance of different genera was presented with a color gradient from deep blue (low abundance) to deep red (high abundance).
