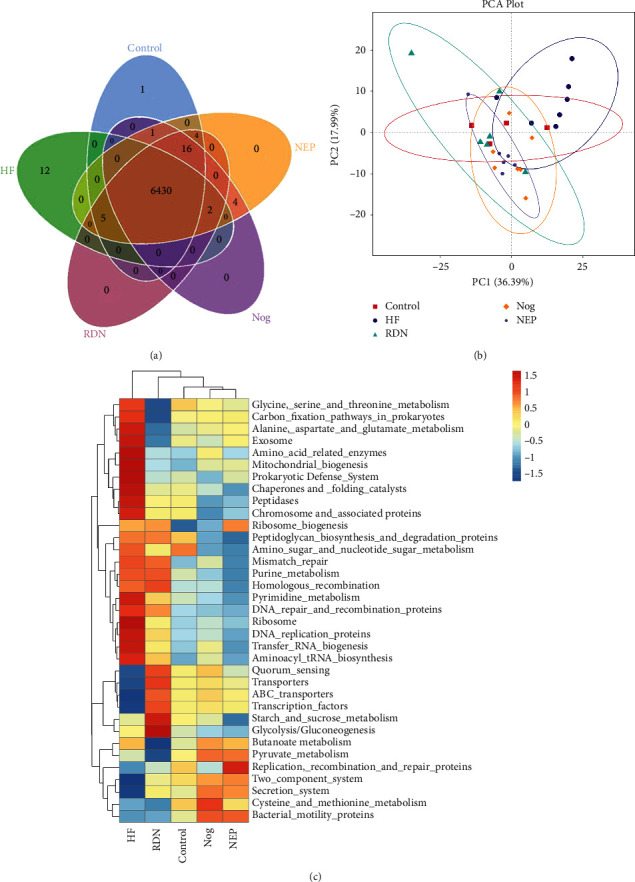
Figure 8.

Functional and pathway enrichment analyses of amplicon sequencing results using the Kyoto Encyclopedia of Genes and Genomes (KEGG) database. (a) Venn diagrams and unique pathways among the intestinal bacterial communities of rats in the control, HF, Nog, and NEP groups. (b) Principal component analysis (PCA) plot showing the first two principal components of the third level KEGG functions. The five groups were not separated well. PC1: the first principal coordinate; PC2: the second principal coordinate. (c) The third level of the KEGG pathway was shown in the heatmap. Relative abundances of different pathways was presented with a color gradient from deep blue (low abundance) to deep red (high abundance).
