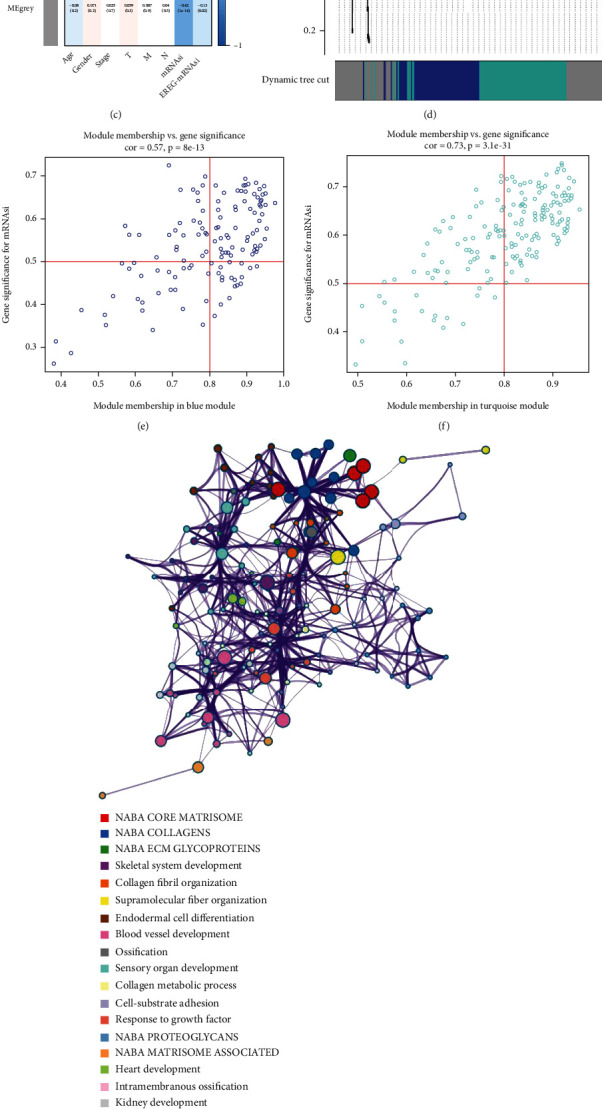
Figure 3.

WGCNA identifying key module and genes significantly related to cancer stemness of COAD. Analysis of the scale-free fit signature for various soft-thresholding powers (a). Analysis of the mean connectivity for various soft-thresholding powers (b). Module-trait relationship between module eigengenes and stemness indices (c). Cluster dendrogram (d). Scatter plot of module eigengenes in turquoise module (e). Scatter plot of module eigengenes in turquoise module (f). Functional enrichment analysis for intersection genes (g). P value of each gene in the network (h).
