Figure 5.

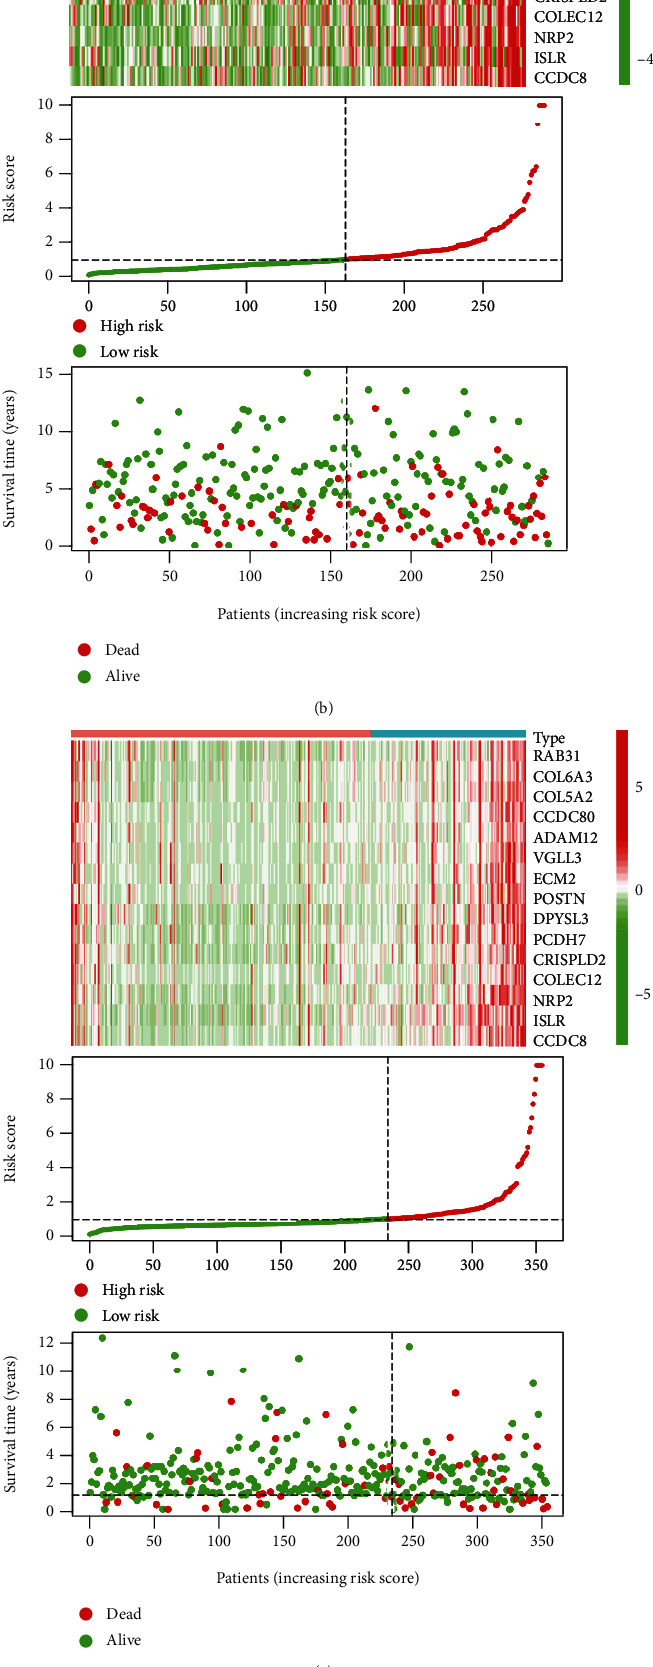
The expression heat map, the distribution of risk score, and survival time of (a) train cohort, (b) test cohort, (c) TCGA cohort, and (d) GSE17538 cohort.

The expression heat map, the distribution of risk score, and survival time of (a) train cohort, (b) test cohort, (c) TCGA cohort, and (d) GSE17538 cohort.