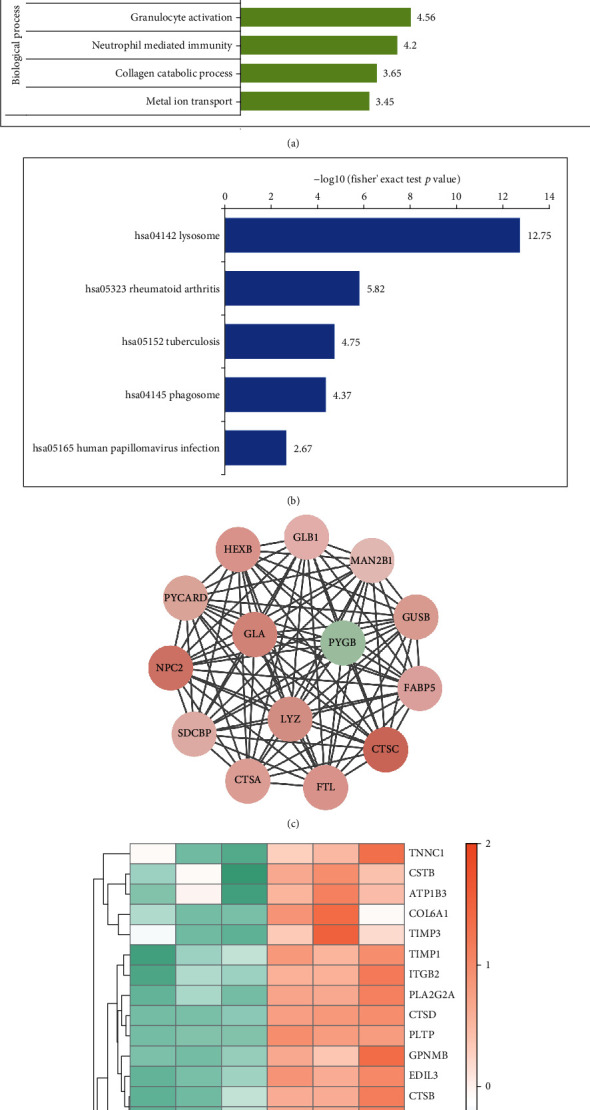
Figure 3.

Function enrichment and the protein-protein interaction (PPI) network module, analysis, and hub gene selection. (a, b) Detailed information relating to changes in the biological processes (BP), cellular components (CC), molecular functions (MF), and the KEGG pathway analysis of DEGs. (c) Results of subnet module I analysis of the PPI network. (d) Some hub protein heat map performed with hierarchical clustering. Orange represents upregulated genes, and green represents downregulated genes.
