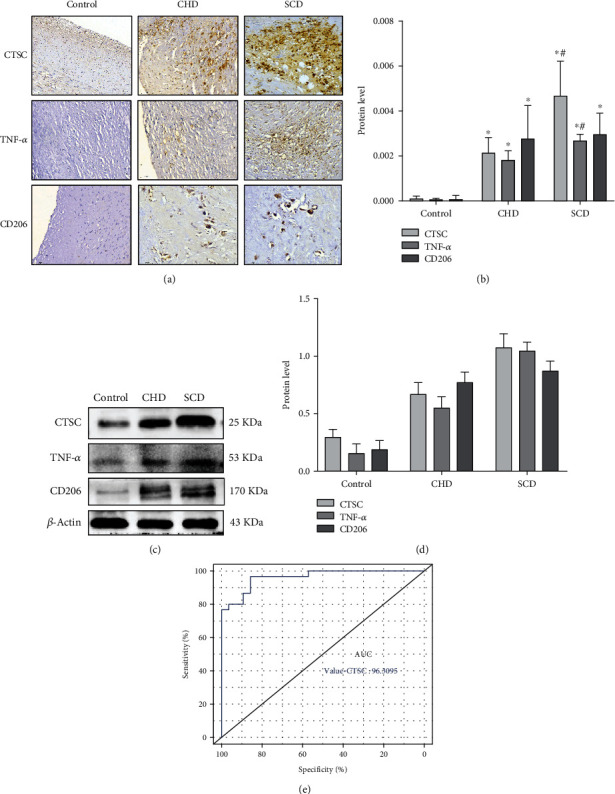
Figure 5.

(a, b) Protein expression and cellular localization of CTSC, TNF-α, and CD206 in different outcomes of coronary atherosclerotic heart disease. The positive expression in the CHD group and the SCD group was significantly higher than that in the control group. (c, d) The protein expression levels of CTSC, TNF-α, and CD206 were determined by Western blot analysis. (e) AUC: area under the ROC curve; ROC: receiver operating characteristic. ∗p < 0.05 compared with the control group; #p < 0.05 compared with the CHD group (Student's t-test). β-Actin was used as a reference protein.
