Figure 7.

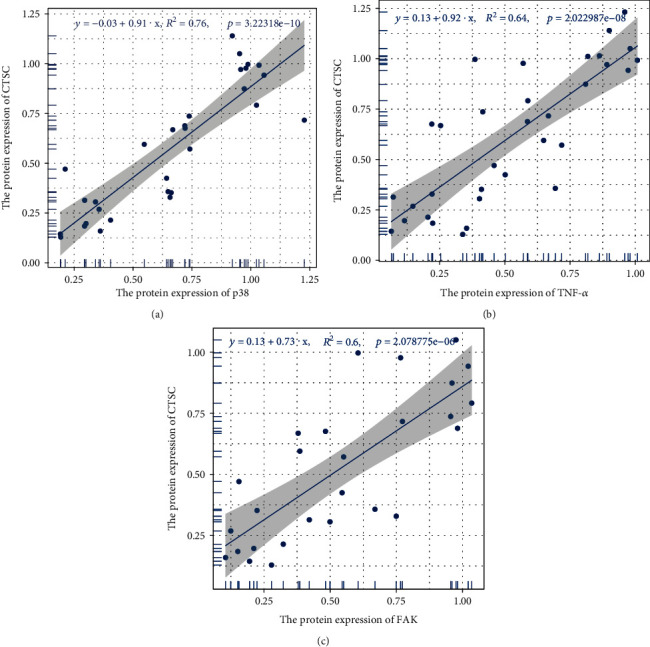
Scatter plots of the linear regression analyses. Scatter plots of the linear regression analyses between CTSC and TNFα, CTSC and FAK, and CTSC and p38. R2 is the determination coefficient.

Scatter plots of the linear regression analyses. Scatter plots of the linear regression analyses between CTSC and TNFα, CTSC and FAK, and CTSC and p38. R2 is the determination coefficient.