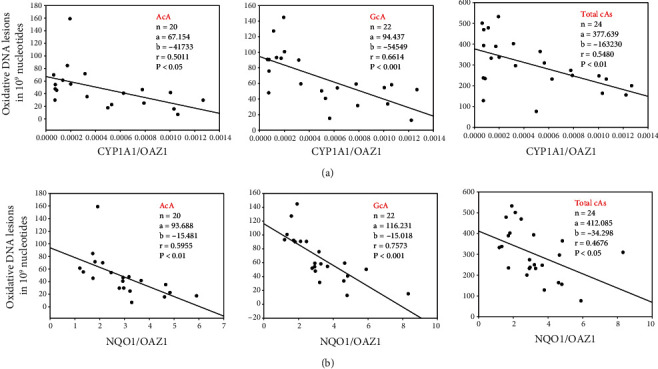
Figure 5.

Linear correlations between levels of 8,5′-cyclopurine-2′-deoxynucleotides (oxidative DNA lesions in 109 normal nucleotides) and CYP1A1/OAZ1 (a) or NQO1/OAZ1 (b) in lung cell lines. Data of DNA adducts from all the individual samples (n = 20‐24) in room air or hyperoxic condition in each cell line were combined and plotted against the mean CYP1A1 (a) or NQO1 (b) gene expression using data from all individual samples. Significant inverse correlations were observed between levels of AcA, GcA, and Total cA (sum of AcA, CcA, GcA, and TcA) and CYP1A1/OAZ1 (a) or NQO1/OAZ1 (b).
