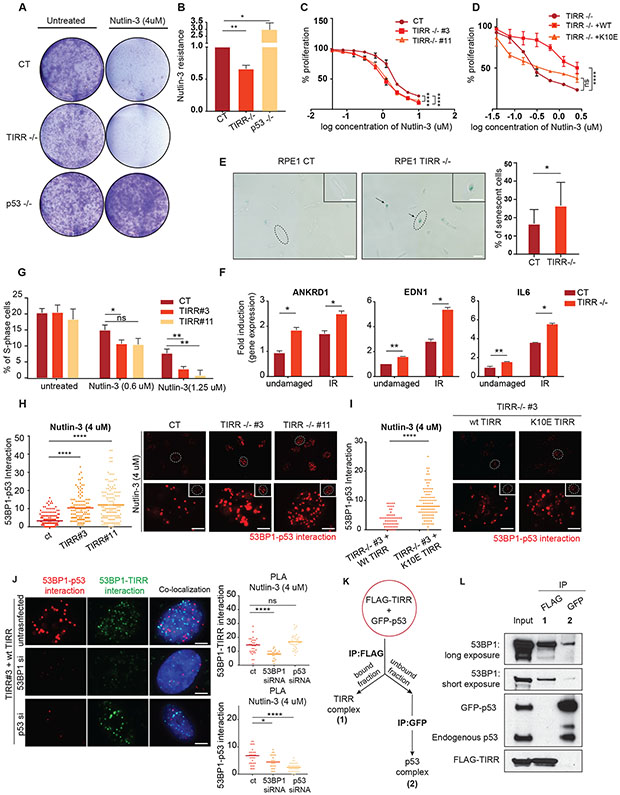
Figure 3: TIRR alters p53-mediated cell fate programs by inhibiting the p53-53BP1 interaction.
A-B) Sensitivity to Nutlin-3 measured by crystal violet staining. Representative images (Fig 3A) and quantification of data (Fig 3B) in RPE1 cells of indicated genotype. Experiment was performed in triplicates.
C-D) Resazurin-based cell survival assay of RPE1 cells of indicated genotype treated with indicated concentrations of Nutlin-3 for 4 days. Experiments were performed in three replicates (p-value <0.0001 (****), p-value > 0.05 (ns)).
E) Representative images of senescent cells in RPE1 WT and TIRR-KO genetic backgrounds. Cells were fixed and stained for beta-galactosidase as a senescence marker. Bar plot represents the quantification of senescent cells (beta gal+) from three different replicates. (Scale bar = 100 μM). (Lighter background on one half of the images was an artifact generated due to the positioning of the apotome).
F) RPE1 WT and TIRR-KO cells were treated with IR (5Gy) and recovered for 10 days. mRNA transcript levels of three senescence biomarkers - ANKRD1, EDN1, and IL6 normalized to Actin. (Mean ± SD)
G) RPE1 cells of indicated genotype were treated with Nutlin-3 for 72 hours. Cells were fixed and stained for Propidium Iodide. Data represents the number of cells in S-phase from three different experiments measured by FACS analysis using ModFit software (see Methods).
H-I) Representative images and quantification of endogenous 53BP1-p53 interaction in RPE1 cells of indicated genotype treated with Nutlin-3 using Proximity Ligation Assay (PLA; see Methods). Positive signals are indicated as red dots. (Scale bar = 5 μM)
J) A 3 probe PLA assay assessing co-localization of TIRR-53BP1 and p53-53BP1 complexes in RPE1 TIRR-KO cells stably expressing WT TIRR (FLAG-WT-TIRR). Cells were transfected with indicated siRNAs. TIRR-p53 complex interaction is indicated by the green dots and p53-53BP1 complex interaction is indicated by the red dots. (Scale bar = 5 μM)
K) Schematic of immunoprecipitation shown in Fig 3L. GFP-p53 was transfected in RPE1 TIRR-KO cells that were stably transduced by FLAG-tagged WT TIRR. FLAG-TIRR was first immunoprecipitated to identify TIRR interacting proteins. The fraction that was unbound to FLAG was used to immunoprecipitate GFP-p53 to identify p53 interacting proteins.
L) Immunoblot of indicated proteins in two different interacting complexes (schematic in Fig. 3K). Complex 1 shows interaction of FLAG-TIRR and 53BP1. Complex 2 shows the interaction of GFP-p53 and 53BP1.

