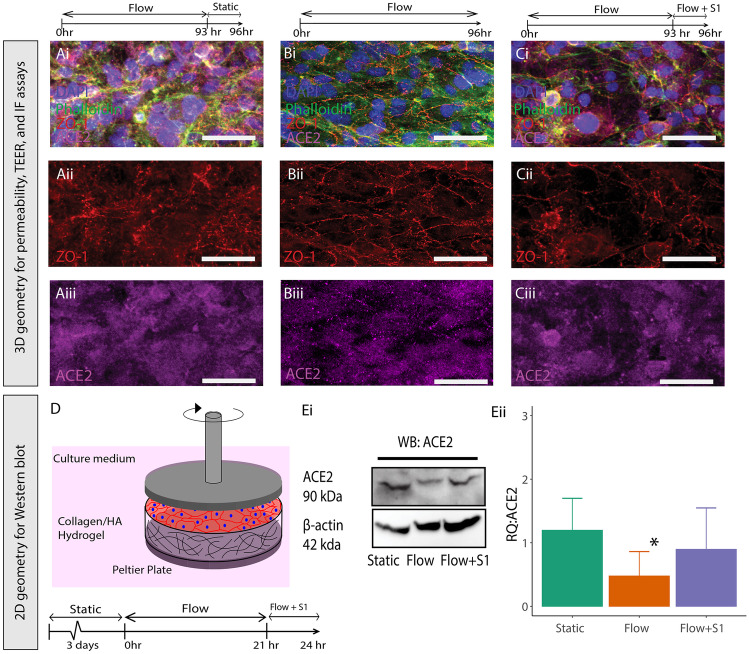
Fig. 1.
A−C Fluorescent images of 3D vessels stained with DAPI (blue), Phalloidin (green), ZO-1( red) (isolated in ii) and ACE2 (magenta)(isolated in iii) for 3 conditions: Static (A), Flow (B), (C) Flow + S1 subunit exposure for 3 h. D Schematic of rheometer setup used to apply fluid shear stress to 2D cultures for protein expression assays. E Western blot of cells exposure to static, flow, or flow + S1 protein (3 h) (i), and ratio of ACE2 to beta-actin normalized to a flow sample (ii). * Indicates p < 0.05 compared to flow. n = 3 for all experiments

