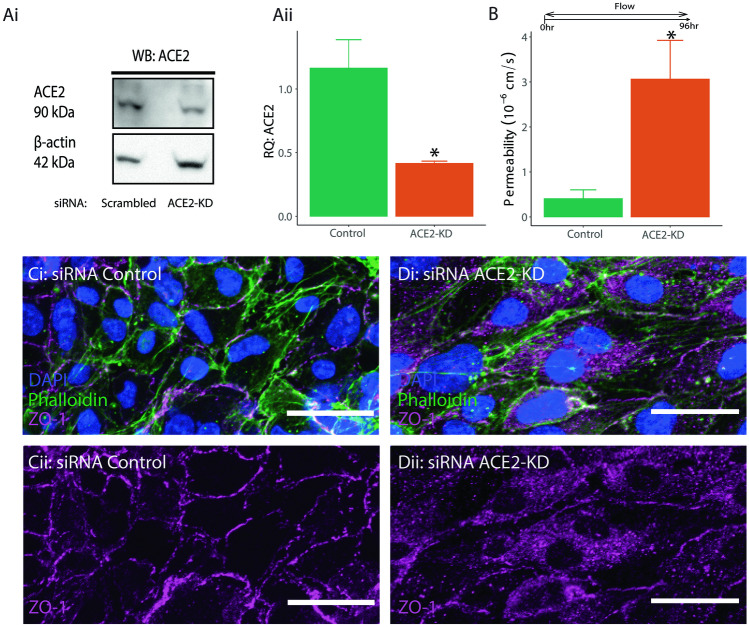
Fig. 2.
A Western blot of cells treated with DsiRNA targeting ACE2 (i), and relative intensity of ACE2 in DsiRNA and control cells normalized to beta-actin (ii). B Permeability coefficients measured in channels seeded with ACE2-Knockdown (KD) HCMEC/D3 cells. *indicates p < 0.05 compared to control. n = 3 for all experiments. C−D Fluorescent images of vessels stained with DAPI (blue), Phalloidin (green), ZO-1( magenta) (isolated in ii)for 3 conditions: siRNA control (C), and siRNA ACE2-KD (D)

