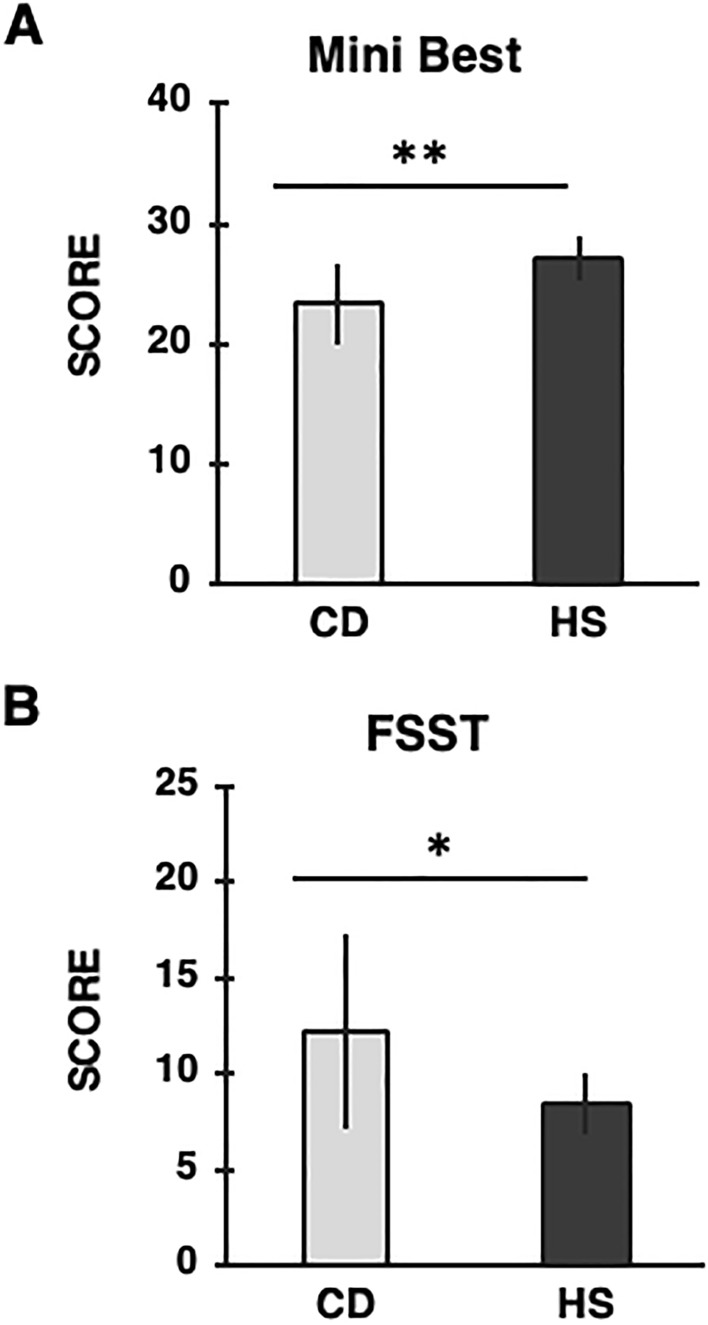
Fig. 2.

Mean values of the: (A) Mini Best Test (score), (B) Four-Square Step Test (FSST; seconds) for each group are reported. Light gray columns refer to cervical dystonia (CD) group, dark gray columns refer to healthy subjects (HS) group. Black bars represent standard deviation (SD). CD patients exhibited a lower score in the Mini Best Test and longer time to complete the FSST. Asterisks indicate significant differences between groups (*p < 0.01; ** p < 0.0001)
